Map showing alpine debris flows triggered by a July 28, 1999 thunderstorm in the central Front Range of Colorado: Debris-flow polygons

Metadata also available as - [Outline] - [Parseable text] - [XML]

Frequently anticipated questions:


What does this data set describe?

Title:
Map showing alpine debris flows triggered by a July 28, 1999 thunderstorm in the central Front Range of Colorado: Debris-flow polygons
Abstract:
On July 28, 1999, about 480 debris flows were triggered by an afternoon thunderstorm along the Continental Divide in Clear Creek and Summit counties in the central Front Range of Colorado. This cover shows the outlines of debris-flow source areas, travel zones, and deposits. Jonathan Godt and Jeffrey Coe mapped the debris flows from 1:12,000 scale color aerial photography using a Kern PG-2 photogrammetric plotter. The photographs were scaled and oriented to the topographic base map using prominent topographic landmarks and plotted on a transparent polyester overlay registered to the topographic base maps at 1:12,000 scale. The mapped landslides were digitized manually in ArcInfo. The final scale of the data are 1:24,000.
  1. How might this data set be cited?
    Godt, Jonathan W., and Coe, Jeffrey A., 2003, Map showing alpine debris flows triggered by a July 28, 1999 thunderstorm in the central Front Range of Colorado: Debris-flow polygons: U.S. Geological Survey Open-File Report 03-050, U.S. Geological Survey, Denver, Colorado.

    Online Links:

    This is part of the following larger work.

    Godt, Jonathan W., and Coe, Jeffrey A., 2003, Map showing alpine debris flows triggered by a July 28, 1999 thunderstorm in the central Front Range of Colorado: U.S. Geological Survey Open-File Report 03-050.

    Online Links:

  2. What geographic area does the data set cover?
    West_Bounding_Coordinate: -105.913431
    East_Bounding_Coordinate: -105.752311
    North_Bounding_Coordinate: 39.774776
    South_Bounding_Coordinate: 39.586585
  3. What does it look like?
    http://geo-nsdi.er.usgs.gov/metadata/open-file/03-50/browse.png (PNG)
    Reduced-size image of the map sheet, 617x822 pixels, 696k bytes
  4. Does the data set describe conditions during a particular time period?
    Calendar_Date: 11-Sep-2000
    Currentness_Reference:
    ground condition
  5. What is the general form of this data set?
    Geospatial_Data_Presentation_Form: vector digital data
  6. How does the data set represent geographic features?
    1. How are geographic features stored in the data set?
      This is a Vector data set. It contains the following vector data types (SDTS terminology):
      • Complete chain (1553)
      • Label point (327)
      • GT-polygon composed of chains (329)
      • Point (546)
    2. What coordinate system is used to represent geographic features?
      Grid_Coordinate_System_Name: Universal Transverse Mercator
      Universal_Transverse_Mercator:
      UTM_Zone_Number: 13
      Transverse_Mercator:
      Scale_Factor_at_Central_Meridian: 0.9996
      Longitude_of_Central_Meridian: -105.0
      Latitude_of_Projection_Origin: 0.0
      False_Easting: 500000.0
      False_Northing: 0.0
      Planar coordinates are encoded using coordinate pair
      Abscissae (x-coordinates) are specified to the nearest 0.000011
      Ordinates (y-coordinates) are specified to the nearest 0.000011
      Planar coordinates are specified in meters
      The horizontal datum used is North American Datum of 1927.
      The ellipsoid used is Clarke 1866.
      The semi-major axis of the ellipsoid used is 6378206.400000.
      The flattening of the ellipsoid used is 1/294.978698.
  7. How does the data set describe geographic features?
    fr-dfcl2.aat
    boundary line
    BOUND
    indicates whether the arc encloses the study area boundary
    ValueDefinition
    stdystudy area boundary
    nullnot study area boundary
    fr-dfcl2.pat
    debris flow or othe polygonal area of interest
    SURFACE
    indicates feature type
    ValueDefinition
    dfdebris flow
    cdchannel deposit - not shown on map
    stdystudy area polygon

Who produced the data set?

  1. Who are the originators of the data set? (may include formal authors, digital compilers, and editors)
    • Jonathan W. Godt
    • Jeffrey A. Coe
  2. Who also contributed to the data set?
  3. To whom should users address questions about the data?
    Jonathan Godt
    U.S. Geological Survey
    Physical Scientist
    Box 25046, MS 966
    Denver, CO
    USA

    303-273-8626 (voice)
    303-273-8600 (FAX)
    jgodt@usgs.gov
    Hours_of_Service: 8am - 4pm MST
    Contact_Instructions: e-mail contact preferred

Why was the data set created?

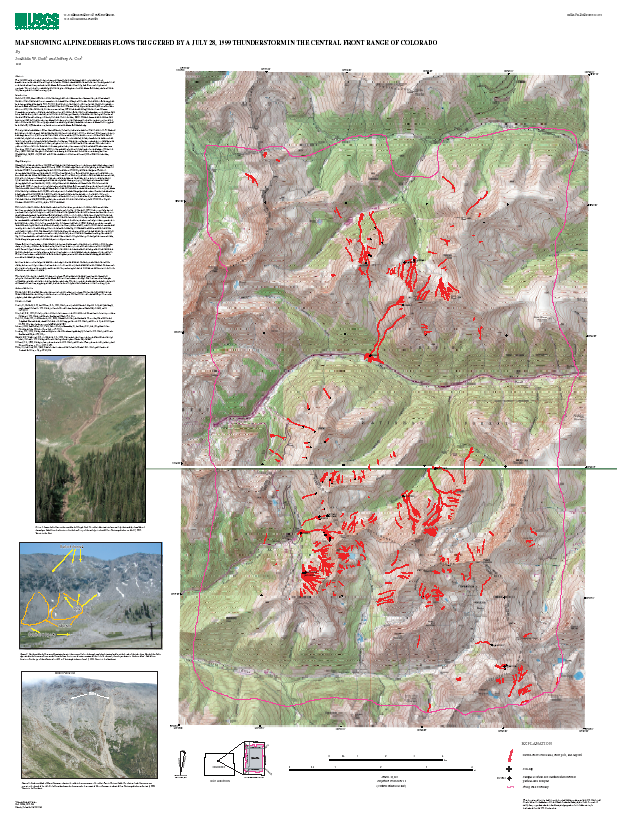
The purpose of these data is provide an inventory the debris flows that were triggered over a 2-square kilometer area in the central Front Range of Colorado by a July 28, 1999 thunderstorm. These data do not consitute a debris-flow hazard map of the area.

How was the data set created?

  1. From what previous works were the data drawn?
  2. How were the data generated, processed, and modified?
    (process 1 of 2)
    The debris-flow source areas, travel paths, and deposits were mapped using 1:12,000-scale color aerial photographs and a Kern PG-2 photogrammetric plotter. The photographs were scaled and oriented to the topographic base map using prominent topographic landmarks and plotted on a transparent polyester overlay registered to the topographic base maps at a scale of 1:12,000. The mapped debris flows were digitized manually in ArcInfo.
    Date: 14-Mar-2003 (process 2 of 2)
    Creation of original metadata record Person who carried out this activity:
    Jonathan W. Godt
    U.S. Geological Survey
    Physical Scientist
    Box 25046, MS 966
    Denver, CO
    USA

    303-273-8626 (voice)
    303-273-8600 (FAX)
    jgodt@usgs.gov
    Hours_of_Service: 8am-4pm MST
    Contact_Instructions: e-mail is preferred contact
  3. What similar or related data should the user be aware of?

How reliable are the data; what problems remain in the data set?

  1. How well have the observations been checked?
  2. How accurate are the geographic locations?
    The scale of the aerial photography allowed us to accurately identify debris-flow features as small as about 0.5 m. At 1:24,000 scale, debris-flow features less than about 5 m wide (~ 0.2 mm at 1:24,000) are not visible.
  3. How accurate are the heights or depths?
  4. Where are the gaps in the data? What is missing?
  5. How consistent are the relationships among the observations, including topology?

How can someone get a copy of the data set?

Are there legal restrictions on access or use of the data?
Access_Constraints: none
Use_Constraints:
This map is an inventory map, not hazard map, and should not be enlarged to a scale larger than 1:24,000.
  1. Who distributes the data set? (Distributor 1 of 1)
    USGS Information Services
    Box 25286 Denver Federal Center
    Denver, CO
    USA

    1-888-ASK-USGS (voice)
    303-202-4693 (FAX)
    ask@usgs.gov
  2. What's the catalog number I need to order this data set? USGS Open-File Report 03-50
  3. What legal disclaimers am I supposed to read?
    This report is preliminary and has not been reviewed for conformity with U.S. Geological Survey editorial standards or with the North American Stratigraphic Code. Any use of trade, firm, or product names is for descriptive purposes only and does not imply endorsement by the U.S. Government.
  4. How can I download or order the data?

Who wrote the metadata?

Dates:
Last modified: 13-Jun-2016
Metadata author:
Peter N Schweitzer
USGS Midwest Area
Collection manager, USGS Geoscience Data Clearinghouse, http://geo-nsdi.er.usgs.gov/
Mail Stop 954
12201 Sunrise Valley Dr
Reston, VA
USA

703-648-6533 (voice)
703-648-6252 (FAX)
pschweitzer@usgs.gov
Metadata standard:
Content Standard for Digital Geospatial Metadata (FGDC-STD-001-1998)

This page is <https://geo-nsdi.er.usgs.gov/metadata/open-file/03-50/flows.faq.html>
Generated by mp version 2.9.48 on Tue Jul 03 20:06:21 2018