Geophysical studies of the Crump Geyser known geothermal resource area, Oregon, in 1975

Metadata also available as - [Outline] - [Parseable text] - [XML]

Frequently anticipated questions:


What does this data set describe?

Title:
Geophysical studies of the Crump Geyser known geothermal resource area, Oregon, in 1975
Abstract:
Gravity map and data used to infer details of the geologic structure of the area. Surveys were conducted during or prior to 1975.
  1. How might this data set be cited?
    Plouff, Donald, 2006, Geophysical studies of the Crump Geyser known geothermal resource area, Oregon, in 1975: Open-File Report 2006-1110, Geological Survey (U.S.), Menlo Park, California.

    Online Links:

  2. What geographic area does the data set cover?
    West_Bounding_Coordinate: -120.081333
    East_Bounding_Coordinate: -119.708333
    North_Bounding_Coordinate: 42.445667
    South_Bounding_Coordinate: 42.002167
  3. What does it look like?
    http://pubs.usgs.gov/of/2006/1110/images/minimap.jpg (JPEG)
    Reduced-size image of a tectonic sketch map of this area, (447 x 580 pixels)
  4. Does the data set describe conditions during a particular time period?
    Calendar_Date: 1975
    Currentness_Reference:
    Original report of 1975 republished in 2006
  5. What is the general form of this data set?
  6. How does the data set represent geographic features?
    1. How are geographic features stored in the data set?
      This is a Point data set. It contains the following vector data types (SDTS terminology):
      • Entity point (355)
    2. What coordinate system is used to represent geographic features?
      Horizontal positions are specified in geographic coordinates, that is, latitude and longitude. Latitude and longitude values are specified in decimal degrees. The horizontal datum used is North American Datum of 1927.
      The ellipsoid used is Clarke 1866.
      The semi-major axis of the ellipsoid used is 6378206.4.
      The flattening of the ellipsoid used is 1/294.98.
  7. How does the data set describe geographic features?
    2006-1110.dbf
    STA_CODE
    Station identification and characteristics Values are given in two parts, separated by a space. The first part is an identifier without substantial scientific significance. The second part is a coded string of four characters, one upper case letter followed by three decimal digits. The characters in this coded string are interpreted according to the following tables:
     Table 2. Location description code (digit one).
       [The number after the alphabetical code indicates the total number of gravity stations for which the code was used.]
     B  45 On level-line benchmark incorporated into U.S. Geological Survey vertical control system.
     N  14 Near benchmark.
     P 188 Location of surveyed elevation.
     X   5 Near location markers such as section corners.
     D   1 Near assumed location of any of the above markers that were destroyed or not found.
     R   1 Lake or reservoir elevation determined from leveling to benchmark.
     F  32 Near a location with or without a marker at which a surveyed elevation is indicated on a published topographic map.
     G  58 Near a location (on a manuscript map or a published map) at which spot elevations are determined by photogrammetry or near a doubtful F-location.
     W  12 Near edge of lake or canal; interpolated elevation or elevation given for water at unknown height relative to present level.
    
     Table 3. Accuracy of elevations (digit two).
     [The number after the numerical code indicates the total number of stations for which the code was used. Note that uncertainty of horizontal location tends to reduce the elevation accuracy].
     Code Number Accuracy (feet)
     1 230  0.1 On benchmark; surveyed elevation
     2  10  0.5 Elevation difference hand-leveled to nearby benchmark
     3   7  1   Near benchmark or checked water level
     4   2  2   Near assumed location of benchmark that was not found
     5  70  5   Near location with 10-foot contour interval
     6  36 10   Photogrammetric elevation on map with 20-foot contour interval
     7   1 20   Uncertain location of spot elevation point
    
     Table 4. Accuracy of horizontal location (digit three).
     [The number after the numerical code indicates the total number of stations for which the code was used.]
     Code Number Accuracy (feet)
     2 252  84 Near section corners and benchmarks; surveyed locations
     3  80 210 Near road intersection, stream crossings, hillcrests
     4  22 420 Road curve; uncertain spot elevation location
     5   2 840 Location depends on odometer measurement or other estimate
    
     Table 5. Accuracy of observed gravity (digit four).
     [The number after the numerical code indicates the total number of stations for which the code was used. Accuracies are relative to the value at the Adel base station.]
     Code Number Accuracy (mgal)
     2   3 0.02 Reading repeated several times
     3   8 0.05 Repeated reading
     4 345 0.10 Non-repeated reading
    
    LATITUDE
    Geographic latitude
    Range of values
    Minimum:42.0021670
    Maximum:42.4456670
    Units:decimal degrees
    LONGITUDE
    Geographic longitude
    Range of values
    Minimum:-120.0813330
    Maximum:-119.7083330
    Units:decimal degrees
    ELEV_FT
    Ground elevation at the observation point
    Range of values
    Minimum:4466.70
    Maximum:6047.00
    Units:feet
    OBS_GRAV
    Observed gravity
    Range of values
    Minimum:919882.550
    Maximum:979969.240
    Units:mGal
    FR_AIR_ANO
    Free air anomaly
    Range of values
    Minimum:-35.050
    Maximum:27.410
    Units:mGal
    TER_HND
    Hand terrain corrections, using conventional cylindrical compartments, estimated in the distance interval from the station location to 0.9 km (2,936 feet)
    Range of values
    Minimum:-0.070
    Maximum:2.750
    TER_TOT
    Total terrain correction
    Range of values
    Minimum:0.570
    Maximum:7.300
    BOUG_2_67
    Complete Bouguer anomaly with reduction density of 2.67 g/cm3
    Range of values
    Minimum:-188.380
    Maximum:-161.080
    Units:mGal
    BOUG_2_50
    Complete Bouguer anomaly with reduction density of 2.50 g/cm3
    Range of values
    Minimum:-178.610
    Maximum:-151.400
    Units:mGal

Who produced the data set?

  1. Who are the originators of the data set? (may include formal authors, digital compilers, and editors)
    • Plouff, Donald
  2. Who also contributed to the data set?
  3. To whom should users address questions about the data?
    Donald Plouff
    USGS WR SW GD
    345 Middlefield Road
    Mail Stop 989
    Menlo Park, CA
    USA

    650-329-5312 (voice)
    650-329-5490 (FAX)
    plouff@usgs.gov

Why was the data set created?

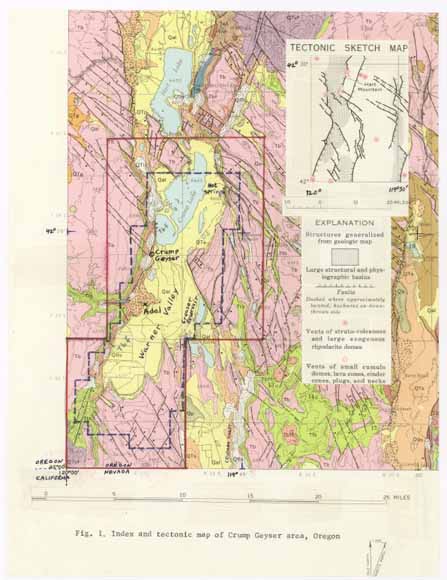
Geophysical information republished in improved formats because the information was otherwise difficult to obtain. Original study was conducted in support of the resource appraisal of the Crump Geyser Known Geothermal Resource Area (KGRA). This area was designated as a KGRA by the USGS, and this designation became effective on December 24, 1970 (Godwin, and others, 1971). The land classification standards for a KGRA were established by the Geothermal Steam Act of 1970 (Public Law 91-581). Federal lands so classified required competitive leasing for the development of geothermal resources.

How was the data set created?

  1. From what previous works were the data drawn?
    NTIS PB-245-426/AS (source 1 of 1)
    Plouff, Donald A., 19750617, Gravity data in Crump Geyser area, Oregon: NTIS PUBLICATION PB-245-426/AS, U.S. Geological Survey, Menlo Park, California.

    Type_of_Source_Media: paper
    Source_Contribution:
    Principal facts of gravity observations obtained from this report
  2. How were the data generated, processed, and modified?
    Date: 06-Jun-2008 (process 1 of 1)
    Creation of original metadata record Person who carried out this activity:
    Peter N Schweitzer
    USGS ER GD
    Geologist
    12201 Sunrise Valley Drive
    Reston, VA
    USA

    703-648-6533 (voice)
    703-648-6252 (FAX)
    pschweitzer@usgs.gov
  3. What similar or related data should the user be aware of?

How reliable are the data; what problems remain in the data set?

  1. How well have the observations been checked?
  2. How accurate are the geographic locations?
  3. How accurate are the heights or depths?
  4. Where are the gaps in the data? What is missing?
  5. How consistent are the relationships among the observations, including topology?

How can someone get a copy of the data set?

Are there legal restrictions on access or use of the data?
Access_Constraints: none
Use_Constraints: none
  1. Who distributes the data set? (Distributor 1 of 1)
    USGS Information Services
    Box 25286, Denver Federal Center
    Denver, Colorado
    USA

    1-888-ASK-USGS (voice)
    1-303-202-4695 (FAX)
    infoservices@usgs.gov
  2. What's the catalog number I need to order this data set? USGS Open-File Report 2006-1110
  3. What legal disclaimers am I supposed to read?
    This report is preliminary and has not been reviewed for conformity with U.S. Geological Survey editorial standards (or with the North American Stratigraphic Code). Any use of trade, product, or firm names is for descriptive purposes only and does not imply endorsement by the U.S. Government.
  4. How can I download or order the data?

Who wrote the metadata?

Dates:
Last modified: 23-Feb-2015
Metadata author:
Peter N Schweitzer
USGS Midwest Area
Collection manager, USGS Geoscience Data Clearinghouse, http://geo-nsdi.er.usgs.gov/
Mail Stop 954
12201 Sunrise Valley Dr
Reston, VA
USA

703-648-6533 (voice)
703-648-6252 (FAX)
pschweitzer@usgs.gov
Metadata standard:
Content Standard for Digital Geospatial Metadata (FGDC-STD-001-1998)

This page is <https://geo-nsdi.er.usgs.gov/metadata/open-file/2006/1110/metadata.faq.html>
Generated by mp version 2.9.48 on Tue Jul 03 20:06:24 2018