Citation:
Citation_Information:
Originator: Schweitzer, Peter N.
Publication_Date: 1993
Title: Modern Average Global Sea-Surface Temperature
Edition: 2.0
Geospatial_Data_Presentation_Form: remote-sensing image
Series_Information:
Series_Name: U.S. Geological Survey Digital Data Series
Issue_Identification: DDS-10
Publication_Information:
Publication_Place: Reston, Virginia
Publisher: U.S. Geological Survey
Online_Linkage: http://pubs.usgs.gov/dds/dds10/
Online_Linkage:
Online_Linkage:
Online_Linkage:
Online_Linkage:
Online_Linkage:
Description:
Abstract:
The data contained in this data set are derived from the NOAA
Advanced Very High Resolution Radiometer Multichannel Sea
Surface Temperature data (AVHRR MCSST), which are obtainable
from the Distributed Active Archive Center at the Jet
Propulsion Laboratory (JPL) in Pasadena, Calif. The JPL tapes
contain weekly images of SST from October 1981 through
December 1990 in nine regions of the world ocean: North
Atlantic, Eastern North Atlantic, South Atlantic, Agulhas,
Indian, Southeast Pacific, Southwest Pacific, Northeast
Pacific, and Northwest Pacific.
This data set represents the results of calculations carried
out on the NOAA data and also contains the source code of the
programs that made the calculations. The objective was to
derive the average sea-surface temperature of each month and
week throughout the whole 10-year series, meaning, for
example, that data from January of each year would be averaged
together. The result is 12 monthly and 52 weekly images for
each of the oceanic regions. Averaging the images in this way
tends to reduce the number of grid cells that lack valid data
and to suppress interannual variability.
Purpose:
The purpose of this data set is to provide paleoclimate
researchers with a tool for estimating the average seasonal
variation in sea-surface temperature (SST) throughout the
modern world ocean and for estimating the modern monthly and
weekly sea-surface temperature at any given oceanic location.
It is expected that these data will be compared with
temperature estimates derived from geological proxy measures
such as faunal census analyses and stable isotopic analyses.
The results can then be used to constrain general circulation
models of climate change.
Supplemental_Information:
As ancillary data, the ETOPO5 global gridded elevation and
bathymetry data (Edwards, 1989) were interpolated to the
resolution of the SST data; the interpolated topographic data
are included.
Time_Period_of_Content:
Time_Period_Information:
Range_of_Dates/Times:
Beginning_Date: 19811001
Ending_Date: 19901231
Currentness_Reference:
Smith, E., 1991, A user's guide to the NOAA Advanced Very High
Resolution Radiometer Multichannel Sea Surface Temperature
data set produced by the University of Miami/Rosenstiel School
of Marine and Atmospheric Science: Distributed by the
Distributed Active Archive Center, Jet Propulsion Laboratory,
Pasadena, California. 10 p.
Status:
Progress: Complete
Maintenance_and_Update_Frequency: Irregular
Spatial_Domain:
Bounding_Coordinates:
West_Bounding_Coordinate: -180.0
East_Bounding_Coordinate: 180.0
North_Bounding_Coordinate: 72.0
South_Bounding_Coordinate: -66.0
Keywords:
Theme:
Theme_Keyword_Thesaurus: USGS Thesaurus
Theme_Keyword: oceanography
Theme_Keyword: sea surface temperature
Theme_Keyword: AVHRR
Theme_Keyword: datasets
Theme:
Theme_Keyword_Thesaurus: ISO 19115 Topic Categories
Theme_Keyword: oceans
Place:
Place_Keyword_Thesaurus: none
Place_Keyword: North Atlantic Ocean
Place_Keyword: South Atlantic Ocean
Place_Keyword: Indian Ocean
Place_Keyword: Pacific Ocean
Place_Keyword: Mediterranean Sea
Place:
Place_Keyword_Thesaurus: Augmented FIPS 10-4 and FIPS 6-4
Place_Keyword: OC13 = North Atlantic
Place_Keyword: OC14 = South Atlantic
Place_Keyword: OC15 = Mediterranean Sea
Place_Keyword: OC16 = Gulf of Mexico
Place_Keyword: OC30 = Indian
Place_Keyword: OC40 = Pacific
Place_Keyword: OC41 = Northeast Pacific
Place_Keyword: OC42 = Northwest Pacific
Place_Keyword: OC43 = Southeast Pacific
Place_Keyword: OC44 = Southwest Pacific
Access_Constraints: none
Use_Constraints: none
Point_of_Contact:
Contact_Information:
Contact_Person_Primary:
Contact_Person: Peter N. Schweitzer
Contact_Address:
Address_Type: mailing address
Address:
Mail Stop 954 National Center
U.S. Geological Survey
12201 Sunrise Valley Drive
City: Reston
State_or_Province: VA
Postal_Code: 20192
Country: USA
Contact_Voice_Telephone: (703) 648-6533
Contact_Facsimile_Telephone: (703) 648-6252
Contact_Electronic_Mail_Address: pschweitzer@usgs.gov
Browse_Graphic:
Browse_Graphic:
Browse_Graphic_File_Name:
Browse_Graphic_File_Description:
August sea-surface temperature in the Western North Atlantic Ocean.
Browse_Graphic_File_Type: GIF
Browse_Graphic:
Browse_Graphic_File_Name:
Browse_Graphic_File_Description:
August sea-surface temperature in the Eastern North Atlantic Ocean.
Browse_Graphic_File_Type: GIF
Browse_Graphic:
Browse_Graphic_File_Name:
Browse_Graphic_File_Description: August sea-surface temperature in the South Atlantic Ocean.
Browse_Graphic_File_Type: GIF
Browse_Graphic:
Browse_Graphic_File_Name:
Browse_Graphic_File_Description:
August sea-surface temperature in the Southeastern Atlantic
and Southwestern Indian Oceans.
Browse_Graphic_File_Type: GIF
Browse_Graphic:
Browse_Graphic_File_Name:
Browse_Graphic_File_Description: August sea-surface temperature in the Indian Ocean.
Browse_Graphic_File_Type: GIF
Browse_Graphic:
Browse_Graphic_File_Name:
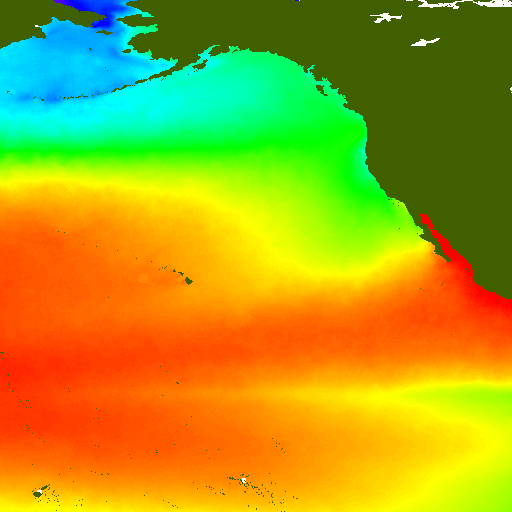
Browse_Graphic_File_Description: August sea-surface temperature in the Northeast Pacific Ocean.
Browse_Graphic_File_Type: GIF
Browse_Graphic:
Browse_Graphic_File_Name:
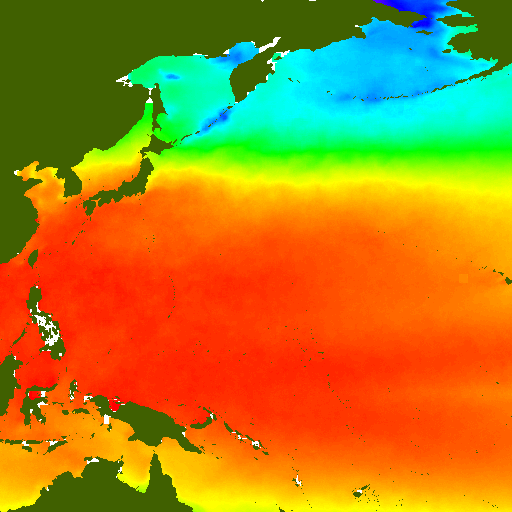
Browse_Graphic_File_Description: August sea-surface temperature in the Northwest Pacific Ocean.
Browse_Graphic_File_Type: GIF
Browse_Graphic:
Browse_Graphic_File_Name:
Browse_Graphic_File_Description: August sea-surface temperature in the Southeast Pacific Ocean.
Browse_Graphic_File_Type: GIF
Browse_Graphic:
Browse_Graphic_File_Name:
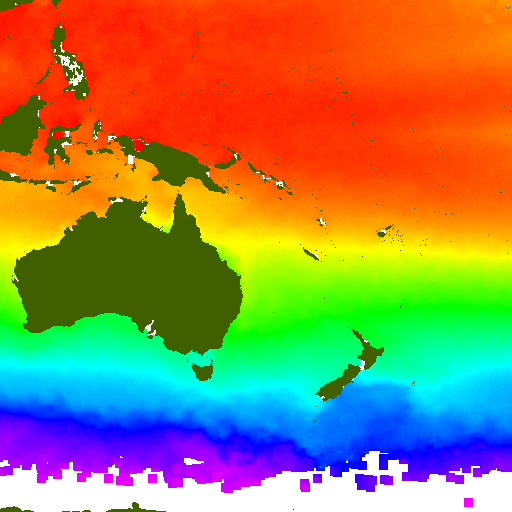
Browse_Graphic_File_Description: August sea-surface temperature in the Southwest Pacific Ocean.
Browse_Graphic_File_Type: GIF
Native_Data_Set_Environment:
Originally compiled under a Data General UNIX system, these
data are now maintained under Linux, and the software written
using Tcl/Tk and C, usable under Linux, UNIX, and Microsoft
Windows. A Mac OSX port is possible but has not been done.
Cross_Reference:
Citation_Information:
Originator: U.S. Geological Survey
Originator: Peter N. Schweitzer (comp.)
Publication_Date: 1995
Title: Monthly Average Polar Sea-Ice Concentration
Geospatial_Data_Presentation_Form: remote-sensing image
Series_Information:
Series_Name: U.S. Geological Survey Digital Data Series
Issue_Identification: DDS-27
Online_Linkage: http://pubs.usgs.gov/dds/dds27/