Online Links:
| Range of values | |
|---|---|
| Minimum: | 64 |
| Maximum: | 67 |
| Units: | degrees |
| Resolution: | 1 |
| Range of values | |
|---|---|
| Minimum: | 0.00 |
| Maximum: | 59.90 |
| Units: | minutes |
| Resolution: | 0.01 |
| Range of values | |
|---|---|
| Minimum: | 141 |
| Maximum: | 151 |
| Units: | degrees |
| Resolution: | 1 |
| Range of values | |
|---|---|
| Minimum: | 0.00 |
| Maximum: | 59.95 |
| Units: | minutes |
| Resolution: | 0.01 |
| Range of values | |
|---|---|
| Minimum: | 154.2 |
| Maximum: | 4722.0 |
| Units: | feet |
| Resolution: | 0.1 |
| Range of values | |
|---|---|
| Minimum: | 981929.03 |
| Maximum: | 982383.30 |
| Units: | mgal |
| Resolution: | 0.01 |
| Value | Definition |
|---|---|
| A | good location, modern published maps, scale 1:63,360 |
| B | poor location, modern published maps, scale 1:63,360 |
| F | good location, old or unpublished maps, scale 1:63,360 |
| G | poor location, old or unpublished maps, scale 1:63,360 |
| I | transfer from smaller-scale field map, old or unpublished maps, scale 1:63,360 |
| K | good location, modern 1:250,000 scale maps |
| L | poor location, modern 1:250,000 scale maps |
| Value | Definition |
|---|---|
| A | LaCoste & Romberg Geodetic meters: 3 ties within 0.1 mGal |
| B | LaCoste & Romberg Geodetic meters: other multiple ties |
| C | LaCoste & Romberg Geodetic meters: ties or drift loops lasting 6 hours |
| D | LaCoste & Romberg Geodetic meters: ties or drift loops lasting 6-24 hours |
| E | LaCoste & Romberg Geodetic meters: ties or drift loops lasting 1-4 days |
| F | LaCoste & Romberg Geodetic meters: ties or drift loops lasting > 4 days |
| G | Worden or World-Wide meters (loop drift control): 3 ties within 0.1 mGal |
| H | Worden or World-Wide meters (loop drift control): other multiple ties |
| I | Worden or World-Wide meters (loop drift control): ties or drift loops lasting 6 hours |
| J | Worden or World-Wide meters (loop drift control): ties or drift loops lasting 6-24 hours |
| K | Worden or World-Wide meters (loop drift control): ties or drift loops lasting 1-4 days |
| L | Worden or World-Wide meters (loop drift control): ties or drift loops lasting > 4 days |
| M | Worden or World-Wide meters (other drift control): 3 ties within 0.1 mGal |
| N | Worden or World-Wide meters (other drift control): other multiple ties |
| O | Worden or World-Wide meters (other drift control): ties or drift loops lasting 6 hours |
| P | Worden or World-Wide meters (other drift control): ties or drift loops lasting 6-24 hours |
| Q | Worden or World-Wide meters (other drift control): ties or drift loops lasting 1-4 days |
| R | Worden or World-Wide meters (other drift control): ties or drift loops lasting > 4 days |
| S | Worden or World-Wide meters (no drift control): 3 ties within 0.1 mGal |
| T | Worden or World-Wide meters (no drift control): other multiple ties |
| U | Worden or World-Wide meters (no drift control): ties or drift loops lasting 6 hours |
| V | Old LaCoste & Romberg or other thermostated meters: 3 ties within 0.1 mGal |
| W | Old LaCoste & Romberg or other thermostated meters: other multiple ties |
| X | Old LaCoste & Romberg or other thermostated meters: ties or drift loops lasting 6 hours |
| Y | Data from other agencies |
| Z | Unstated reasons to expect errors |
| Value | Definition |
|---|---|
| A | bench marks |
| B | highway and railway surveys |
| C | sea level |
| D | special surveys |
| E | US Weather Bureau, FAA, and U-Wisconsin surveys |
| F | black map elevations |
| G | brown map elevations |
| H | blue map elevations |
| I | elevations from unpublished maps |
| J | river gradient interpolation, contour interval 0-50 ft |
| K | river gradient interpolation, contour interval 100 ft |
| L | river gradient interpolation, contour interval 200 ft |
| M | good contour interpolation, contour interval 0-50 ft |
| N | good contour interpolation, contour interval 100 ft |
| O | good contour interpolation, contour interval 200 ft |
| P | poor contour interpolation, contour interval 0-100 ft |
| Q | poor contour interpolation, contour interval 200 ft |
| R | Altimetry, good repeated readings, base distance < 15 miles |
| S | Altimetry, good repeated readings, base distance 15-70 miles |
| T | Altimetry, alticorder or other good base control, base distance < 15 miles |
| U | Altimetry, alticorder or other good base control, base distance 15-70 miles |
| V | Altimetry, poor control, base distance < 15 miles |
| W | Altimetry, poor control, base distance 15-70 miles |
| X | Altimetry, poor control, base distance > 70 miles |
| Y | Altimetry involving special adjustments |
| ? | no data |
| @ | Elevation from nearby bench marks |
| $ | Elevation from differential GPS |
| % | Elevation from GPS |
| Value | Definition |
|---|---|
| 1 | gravity anomaly accuracy, milligals 0.01 Local surveys with special gravity meters and leveling |
| 2 | gravity anomaly accuracy, milligals 0.02 Multiple readings with LaCoste & Romberg meters on hard, surveyed surfaces |
| 3 | gravity anomaly accuracy, milligals 0.05 Average LaCoste & Romberg data at stable bench marks |
| 4 | gravity anomaly accuracy, milligals 0.10 Average LaCoste & Romberg or Worden data at sea level or frost-affected bench marks |
| 5 | gravity anomaly accuracy, milligals 0.2 Worden or LaCoste & Romberg data with poor drift or closure errors, or average data at vertical angle bench marks |
| 6 | gravity anomaly accuracy, milligals 0.5 Data from loops with closure errors this large, or good data using river gradients, good photogrammetric elevations or well controlled altimetry |
| 7 | gravity anomaly accuracy, milligals 1.0 Most surveys based on reasonable altimetry |
| 8 | gravity anomaly accuracy, milligals 2.0 Data using moderate-distance altimetry in variable weather or spot elevations on 100-ft contour interval maps |
| 9 | gravity anomaly accuracy, milligals 5.0 Data using long-range altimetry in bad weather or contour interpolation on 200-ft contour interval maps |
| 0 | gravity anomaly accuracy, milligals >5.0 Data from surveys using long-distance altimetry or altimetry with control failures or errors or some 500-ft contour interval reconnaissance maps |
| Range of values | |
|---|---|
| Minimum: | -75.08 |
| Maximum: | 117.11 |
| Units: | mgal |
| Resolution: | 0.01 |
| Range of values | |
|---|---|
| Minimum: | -98.67 |
| Maximum: | 18.11 |
| Units: | mgal |
| Resolution: | 0.01 |
| Range of values | |
|---|---|
| Minimum: | 0.00 |
| Maximum: | 0.00 |
| Units: | mgal |
| Range of values | |
|---|---|
| Minimum: | -0.23 |
| Maximum: | 25.37 |
| Units: | mgal |
| Resolution: | 0.01 |
| Range of values | |
|---|---|
| Minimum: | -88.99 |
| Maximum: | 18.75 |
| Units: | mgal |
| Resolution: | 0.01 |
| Range of values | |
|---|---|
| Minimum: | -39.74 |
| Maximum: | 62.08 |
| Units: | mgal |
| Resolution: | 0.01 |
| Value | Definition |
|---|---|
| (no value) | |
| N | 1967 ellipsoid and conversion of Barnes Alaska datum to IGSN-71 datum |
| Range of values | |
|---|---|
| Minimum: | 0 |
| Maximum: | 4694 |
| Units: | feet |
| Resolution: | 1 |
| Range of values | |
|---|---|
| Minimum: | -91.5 |
| Maximum: | 78.5 |
| Units: | mgal |
| Resolution: | 0.1 |
| Value | Definition |
|---|---|
| ISO | isostatic correction made from station to 166.7 km. |
| ISOW | isostatic correction made for the whole earth |
| Value | Definition |
|---|---|
| 0 | |
| 1 | |
| 2 |
| Range of values | |
|---|---|
| Minimum: | 0.00000 |
| Maximum: | 1.00252 |
| Resolution: | 0.00001 |
| Range of values | |
|---|---|
| Minimum: | 8 |
| Maximum: | 11 |
| Units: | hours |
| Resolution: | 0.00001 |
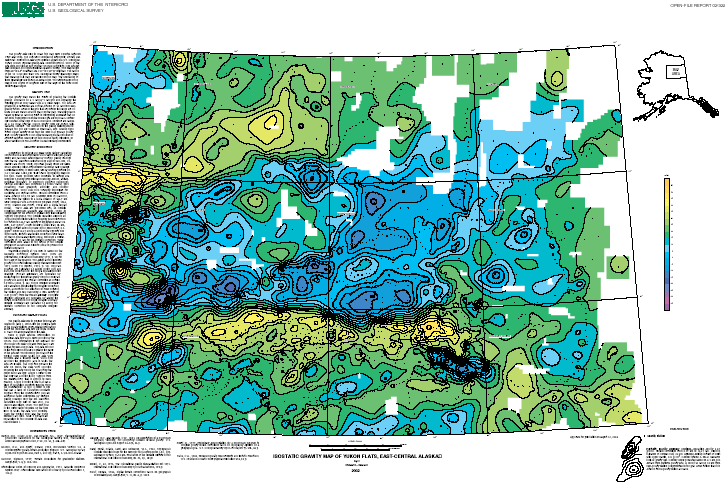
This map was produced to examine gravity anomalies associated with sedimentary basins in the area.
Are there legal restrictions on access or use of the data?Access_Constraints: none
Use_Constraints: none
Although this digital spatial data has been subjected to rigorous review and is substantially complete, it is released on the condition that neither the USGS nor the United States Government may be held liable for any damage resulting from its authorized or unauthorized use.
| Data format: | Gravity measurements and associates survey data in format Microsoft Word Size: 0.5859 |
|---|---|
| Network links: |
http://pubs.usgs.gov/of/2002/0322/table1.doc http://pubs.usgs.gov/of/2002/0322/table2.doc |
| Data format: | Gravity measurements and associated survey data in format Shapefile (version 1.0) Size: 0.1055 |
|---|---|
| Network links: |
http://geo-nsdi.er.usgs.gov/metadata/open-file/02-322/data.zip |