Landslides triggered by Hurricane Mitch in El Salvador

Metadata also available as - [Outline] - [Parseable text] - [XML]

Frequently anticipated questions:


What does this data set describe?

Title: Landslides triggered by Hurricane Mitch in El Salvador
Abstract:
This cover contains the outlines of landslides and debris flows caused by heavy rainfall associated with Hurricane Mitch in October-November 1998. The landslides and debris flows shown in this coverage were mapped using 1:40,00-scale and 1:15,000-scale black-and-white aerial photographs. Much of the photography was taken a few months after the storm, but additional photography was taken in late 2000. The photographs were visually examined using 4-X mirror stereoscopes, and the landslides were plotted by hand on mylar overlays that were registered to topographic maps. The landslides were plotted on 1:25,000-scale maps where these high-quality maps were available; for other parts of the country, the landslides were plotted on 1:50,000-scale maps. The plotted landslides were then manually digitized and registered to digital raster graphic (DRG) images of 1:50,000-scale topographic maps. Some of the areas in this coverage are composites of parts of two or more 12:50,000-scale quadrangles. To produce these composites, the edges of adjoining quadrangles had to be digitally adjusted in ArcInfo to assure continuity between adjacent maps. These adjustments were also necessary to resolve differences in the resolution between 1:50,000-scale and 1:25,000-scale topographic maps. After these adjustments, the areas of each plate were cut from merged DRGs and the digital landslides were then plotted on the DRG images of the map areas. The cover portrays the shapes, relative location, and size of landslides and the associated downslope channel deposits caused by the hurricane. For those features that were originally mapped on 1:25,000-scale topographic maps, we estimate that their locations are accurate to within less than 100 m and probably to within 50m. For features that were originally mapped on 1:50,000-scale topographic maps, their locations are probably accurate to within 100-200m.
  1. How might this data set be cited?
    Crone, Anthony J., Baum, Rex L., Lidke, David J., Sather, Damon N.D., Bradley, Lee-Ann, and Tarr, Arthur C., 2001, Landslides triggered by Hurricane Mitch in El Salvador: U.S. Geological Survey Open-File Report 01-444, U.S. Geological Survey, Denver, CO.

    Online Links:

    This is part of the following larger work.

    Crone, Anthony J., Baum, Rex L., Lidke, David J., Sather, Damon N.D., Bradley, Lee-Ann, and Tarr, Arthur C., 2001, Landslides Induced by Hurricane Mitch in El Salvador--An Inventory and Descriptions of Selected Features: U.S. Geological Survey Open-File Report 01-444, U.S. Geological Survey, Denver, CO.

    Online Links:

  2. What geographic area does the data set cover?
    West_Bounding_Coordinate: -89.970306
    East_Bounding_Coordinate: -87.981537
    North_Bounding_Coordinate: 14.401690
    South_Bounding_Coordinate: 13.351671
  3. What does it look like?
    http://geo-nsdi.er.usgs.gov/metadata/open-file/01-444/01-444.png (PNG)
    Map showing study areas and aerial photograph coverage, 585x439 pixels, 16k bytes.
  4. Does the data set describe conditions during a particular time period?
    Calendar_Date: Dec-2001
    Currentness_Reference:
    publication date
  5. What is the general form of this data set?
    Geospatial_Data_Presentation_Form: vector digital data
  6. How does the data set represent geographic features?
    1. How are geographic features stored in the data set?
      This is a Vector data set. It contains the following vector data types (SDTS terminology):
      • Complete chain (725)
      • Label point (623)
      • GT-polygon composed of chains (621)
      • Point (176)
    2. What coordinate system is used to represent geographic features?
      Horizontal positions are specified in geographic coordinates, that is, latitude and longitude. Latitude and longitude values are specified in Decimal degrees. The horizontal datum used is North American Datum of 1927.
      The ellipsoid used is Clarke 1866.
      The semi-major axis of the ellipsoid used is 6378206.4.
      The flattening of the ellipsoid used is 1/294.978698.
  7. How does the data set describe geographic features?
    Landslide
    polygon in elsmitchlsdd.pat
    LS
    relation of landslide polygon to Hurricane mitch
    ValueDefinition
    0Area not a landslide (may be unaffected region within a landslide)
    1Landslide triggered by Hurricane Mitch
    9Landslide that is believed to have been triggered by Hurricane Mitch but was not field-checked.

Who produced the data set?

  1. Who are the originators of the data set? (may include formal authors, digital compilers, and editors)
    • Anthony J. Crone
    • Rex L. Baum
    • David J. Lidke
    • Damon N.D. Sather
    • Lee-Ann Bradley
    • Arthur C. Tarr
  2. Who also contributed to the data set?
  3. To whom should users address questions about the data?
    Anthony J Crone
    U.S. Geological Survey, CR
    Mail Stop 966
    P.O. Box 25046
    Lakewood, CO
    USA

    303-273-8591 (voice)
    303-273-8600 (FAX)
    crone@usgs.gov

Why was the data set created?

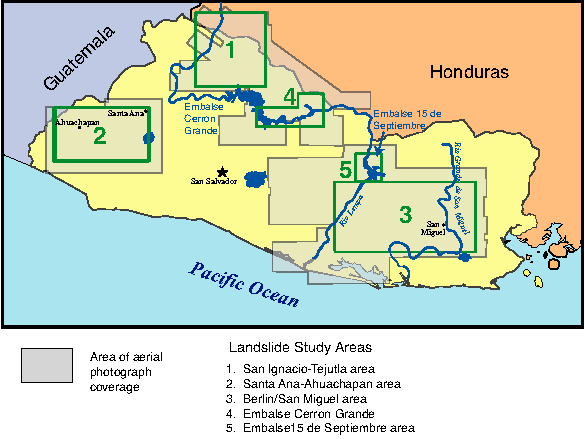
The coverage shows the distribution of slope failures and the associated deposits caused by Hurricane Mitch in El Salvador. The cover included maps of these features in widely separated parts of the country. The maps provide an inventory of these features and also contain a few recent landslides that predate the hurricane. When data from this inventory is combined with geotechnical data on the physical properties of material on hill slopes, the hillslope form, and rainfall intensity and duration information, this coverage can be used as a basis for evaluating landslide susceptibility in similar areas of the country.

How was the data set created?

  1. From what previous works were the data drawn?
    (source 1 of 1)
    Type_of_Source_Media: aerial photographs
    Source_Scale_Denominator: 15000 and 40000
  2. How were the data generated, processed, and modified?
    Date: 1910 (process 1 of 2)
    Aerial photographs taken between December 1998 and December 2000. Some photographs were part of a cooperative program between the Japanese International Cooperative Agency (JICA) and the Government of El Salvador and are available the the Salvadoran National Geographic Institute (IGN). Other photographs were acquired by the USGS under contract and are archive at the USGS's Eros Data Center, Sioux Falls, South Dakota. Digital Raster Graphics (DRG) scanned images of 1:50,000-scale quadrangles projected to Transverse Mercator were used as base maps for the mapping. We mapped the cloud cover by first locating it on the aerial photographs using a mirror stereoscope and then manually plotting by inspection a polygon that best represented the shape and size of the landslides onto the base maps. Many of base maps were at a scale of 1:25,000-scale; for some areas, only 1:50,000-scale base maps were available. The mapped areal extent of the landslides were digitized, and then digitally registered to the DRG base maps. Final maps are presented at 1:50,000 scale.
    Date: 17-Jan-2002 (process 2 of 2)
    Creation of original metadata record Person who carried out this activity:
    Anthony J Crone
    U.S. Geological Survey, CR
    Mail Stop 966
    P.O. Box 25046
    Lakewood, CO
    USA

    303-273-8591 (voice)
    303-273-8600 (FAX)
    crone@usgs.gov
  3. What similar or related data should the user be aware of?

How reliable are the data; what problems remain in the data set?

  1. How well have the observations been checked?
    Attribute accuracy was assured by visually comparing compilation copy with plotted map in which the landslide styles were color coded.
  2. How accurate are the geographic locations?
    For those landslides that were originally mapped on 1:25,000-scale topographic maps, we estimate that their locations are accurate to within less than 100 m and probably to within 50m. For features that were originally mapped on 1:50,000-scale topographic maps, their locations are probably accurate to within 100-200m.
  3. How accurate are the heights or depths?
  4. Where are the gaps in the data? What is missing?
    Completeness was assured by visually inspecting the compilation map overlaid on the plotted map looking for missing polygons.
  5. How consistent are the relationships among the observations, including topology?
    Registration accuracy was checked by inspecting plots of the data and graticule overlaid on a Digital Raster Graphic (DRG) of the base map. Topological consistency was checked by assuring that all data polygons had one label point.

How can someone get a copy of the data set?

Are there legal restrictions on access or use of the data?
Access_Constraints: none
Use_Constraints: none
  1. Who distributes the data set? (Distributor 1 of 1)
    USGS Information Services
    Box 25286 Denver Federal Center
    Denver, CO
    USA

    1-888-ASK-USGS (voice)
    303-202-4693 (FAX)
    ask@usgs.gov
  2. What's the catalog number I need to order this data set? USGS Open-File Report 01-444
  3. What legal disclaimers am I supposed to read?
    This report is preliminary and has not been reviewed for conformity with U.S.Geological Survey editorial standards nor with the North American Stratigraphic Code.Any use of trade names in this publication is for descriptive purposes only and does not imply endorsement by the U.S.Government.
  4. How can I download or order the data?

Who wrote the metadata?

Dates:
Last modified: 04-Feb-2015
Metadata author:
Peter N Schweitzer
USGS Midwest Area
Collection manager, USGS Geoscience Data Clearinghouse, http://geo-nsdi.er.usgs.gov/
Mail Stop 954
12201 Sunrise Valley Dr
Reston, VA
USA

703-648-6533 (voice)
703-648-6252 (FAX)
pschweitzer@usgs.gov
Metadata standard:
Content Standard for Digital Geospatial Metadata (FGDC-STD-001-1998)

This page is <https://geo-nsdi.er.usgs.gov/metadata/open-file/01-444/landslides.faq.html>
Generated by mp version 2.9.48 on Tue Jul 03 20:05:59 2018