Landslides in Los Amates quadrangle, Guatemala

Metadata also available as - [Outline] - [Parseable text] - [XML]

Frequently anticipated questions:


What does this data set describe?

Title: Landslides in Los Amates quadrangle, Guatemala
Abstract:
This cover contains the outlines of landslides formed during Hurricane Mitch in October - November 1998. Jeffrey Coe and Robert Bucknam mapped the landslides and related effects in and adjacent to downstream drainages. Most landslides were mapped using 1:40,000-scale aerial photographs and a Kern PG-2 photogrammetric plotter at 4X and 8X magnifications. The photographs were scaled and oriented to the topographic base map using prominent topographic landmarks and plotted on a transparent polyester overlay registered to the topographic base maps at scales of 1:50,000 or 1:25,000. In areas where landslides were very sparse, the aerial photographs were scanned with a mirror stereoscope at 4X magnification, and landslide locations were transferred to base maps by inspection. The mapped landslides were digitized manually or by an optical scanner, and the data were then digitally registered to a digital version of the base map in ArcInfo.
  1. How might this data set be cited?
    Bucknam, Robert C., Coe, Jeffrey A., and Mota, Manuel Antonio, 2001, Landslides in Los Amates quadrangle, Guatemala: U.S. Geological Survey Open-File Report 01-443, U.S. Geological Survey, Denver, CO.

    Online Links:

    This is part of the following larger work.

    Bucknam, Robert C., Coe, Jeffrey A., Mota, Manuel Antonio, Godt, Jonathan W., Tarr, Arthur C., Bradley, Lee-Ann, Rafferty, Sharon, Hancock, Dean, Dart, Richard L., and Johnson, Margo L., 2001, Landslides Triggered by Hurricane Mitch in Guatemala - Inventory and Discussion: U.S. Geological Survey Open-File Report 01-443, U.S. Geological Survey, Denver, Colorado.

    Online Links:

  2. What geographic area does the data set cover?
    West_Bounding_Coordinate: -89.235968
    East_Bounding_Coordinate: -89.007476
    North_Bounding_Coordinate: 15.333335
    South_Bounding_Coordinate: 15.167803
  3. What does it look like?
    http://geo-nsdi.er.usgs.gov/metadata/open-file/01-443/01-443.png (PNG)
    Index map showing general area of landslide assessment, 462x476 pixels, 9k bytes.
  4. Does the data set describe conditions during a particular time period?
    Beginning_Date: Oct-1998
    Ending_Date: Nov-1998
    Currentness_Reference:
    ground condition
  5. What is the general form of this data set?
    Geospatial_Data_Presentation_Form: vector digital data
  6. How does the data set represent geographic features?
    1. How are geographic features stored in the data set?
      This is a Vector data set. It contains the following vector data types (SDTS terminology):
      • Complete chain (515)
      • Label point (493)
      • GT-polygon composed of chains (493)
      • Point (4)
    2. What coordinate system is used to represent geographic features?
      The map projection used is Transverse Mercator.
      Projection parameters:
      Scale_Factor_at_Central_Meridian: 1.000000
      Longitude_of_Central_Meridian: -89.125000
      Latitude_of_Projection_Origin: 15.166667
      False_Easting: 0.000000
      False_Northing: 0.000000
      Planar coordinates are encoded using coordinate pair
      Abscissae (x-coordinates) are specified to the nearest 0.000064
      Ordinates (y-coordinates) are specified to the nearest 0.000064
      Planar coordinates are specified in meters
      The horizontal datum used is North American Datum of 1927.
      The ellipsoid used is Clarke 1866.
      The semi-major axis of the ellipsoid used is 6378206.400000.
      The flattening of the ellipsoid used is 1/294.978698.
  7. How does the data set describe geographic features?
    Landslide
    Polygon delineating the planimetric area of a landslide found in coverages whose names begin with ls, ols, or yls
    LS
    Some regions within landslides were apparently unaffected by the landslide (that is, they represent areas bypassed by the landslide but are within its outer boundaries) This attribute is used to distinguish those areas from the landslide itself.
    ValueDefinition
    1Landslide polygon
    0Unaffected region within landslide polygon
    Mapped area
    Polygon in the mm coverages, used to indicate the method by which landslides were identified, found in coverages whose names begin with mm.
    MM
    Mapping method
    ValueDefinition
    mirrorlandslide features mapped with a mirror stereoscope
    plotterthe landslide features within the polygon were mapped with a photogrammetric stereoplotter
    notmappolygon falls outside the defined study area

Who produced the data set?

  1. Who are the originators of the data set? (may include formal authors, digital compilers, and editors)
    • Robert C. Bucknam
    • Jeffrey A. Coe
    • Manuel Antonio Mota
  2. Who also contributed to the data set?
    This report is based on a cooperative study by the U.S. Geological Survey, Denver, Colorado and the Instituto Nacional de Sismologia, Vulcanologia, Meteorologia e Hidrologia, Guatemala City, Guatemala. Work funded by the U.S. Agency for International Development's Hurricane Mitch Reconstruction Program.
  3. To whom should users address questions about the data?
    Jeffrey A Coe
    U.S. Geological Survey, CR
    Hydrologist
    Mail Stop 966
    P.O. Box 25046
    Lakewood, CO
    USA

    303-273-8606 (voice)
    303-273-8600 (FAX)
    jcoe@usgs.gov

Why was the data set created?

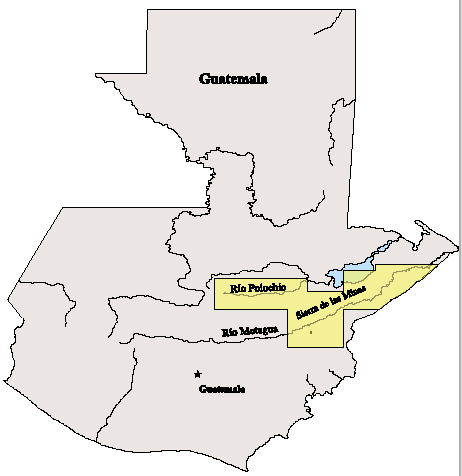
The cover shows the distribution of slope failures formed during Hurricane Mitch in one of twenty 1:50,000-scale maps within a large study area adjacent to the Motagua and Polochic Rivers. The maps may also show recent landslides that formed prior before and after 1998. When combined, the maps provide a detailed inventory of landslides over a large geographic area (~10,000 km2) of diverse geology, geomorphology, microclimates, and vegetation.

How was the data set created?

  1. From what previous works were the data drawn?
    (source 1 of 1)
    Type_of_Source_Media: aerial photographs
    Source_Scale_Denominator: 40000
  2. How were the data generated, processed, and modified?
    (process 1 of 2)
    Most landslides were mapped using 1:40,000-scale aerial photographs and a Kern PG-2 photogrammetric plotter at 4X and 8X magnifications. The photographs were scaled and oriented to the topographic base map using prominent topographic landmarks and plotted on a transparent polyester overlay registered to the topographic base maps at a scale of 1:50,000 or 1:25,000. In areas where landslides were very sparse, the aerial photographs were scanned with a mirror stereoscope at 4X magnification, and landslide locations were transferred to base maps by inspection. The mapped landslides were digitized manually or by an optical scanner, and the data were then digitally registered to a digital version of the base map in ArcInfo. Person who carried out this activity:
    Jonathan W. Godt
    U.S. Geological Survey

    (303) 273-8626 (voice)
    (303) 273-8600 (FAX)
    jgodt@usgs.gov
    Hours_of_Service: 0800 - 1630 Mountain Time M-F
    Contact_Instructions: E-mail is preferred
    Date: 04-Jan-2002 (process 2 of 2)
    Creation of original metadata record Person who carried out this activity:
    Jonathan W Godt
    U.S. Geological Survey, CR
    Mail Stop 966
    P.O. Box 25046
    Lakewood, CO
    USA

    303-273-8626 (voice)
    303-273-8600 (FAX)
    jgodt@usgs.gov
  3. What similar or related data should the user be aware of?

How reliable are the data; what problems remain in the data set?

  1. How well have the observations been checked?
  2. How accurate are the geographic locations?
    The linework was digitized manually or by an optical scanner. Landslide locations mapped using the photogrammetric plotter are estimated accurate to within 50-100 m. Locations of landslides mapped using a mirror stereoscope are estimated to be accurate to within approximately 200 m.
  3. How accurate are the heights or depths?
  4. Where are the gaps in the data? What is missing?
  5. How consistent are the relationships among the observations, including topology?

How can someone get a copy of the data set?

Are there legal restrictions on access or use of the data?
Access_Constraints: None
Use_Constraints:
These maps are inventory maps, not hazard maps, and should not be enlarged to a scale larger than 1:50,000.
  1. Who distributes the data set? (Distributor 1 of 1)
    USGS Information Services
    Box 25286 Denver Federal Center
    Denver, CO
    USA

    1-888-ASK-USGS (voice)
    303-202-4693 (FAX)
    ask@usgs.gov
  2. What's the catalog number I need to order this data set? USGS Open-File Report 01-443
  3. What legal disclaimers am I supposed to read?
    This report is preliminary and has not been reviewed for conformity with U.S.Geological Survey editorial standards nor with the North American Stratigraphic Code.Any use of trade names in this publication is for descriptive purposes only and does not imply endorsement by the U.S.Government.
  4. How can I download or order the data?

Who wrote the metadata?

Dates:
Last modified: 23-Feb-2015
Metadata author:
Peter N Schweitzer
USGS Midwest Area
Collection manager, USGS Geoscience Data Clearinghouse, http://geo-nsdi.er.usgs.gov/
Mail Stop 954
12201 Sunrise Valley Dr
Reston, VA
USA

703-648-6533 (voice)
703-648-6252 (FAX)
pschweitzer@usgs.gov
Metadata standard:
FGDC Content Standards for Digital Geospatial Metadata (FGDC-STD-001-1998)

This page is <https://geo-nsdi.er.usgs.gov/metadata/open-file/01-443/Los_Amates/ls23611.faq.html>
Generated by mp version 2.9.48 on Tue Jul 03 20:05:50 2018