Principal Facts for Gravity Stations in the Vicinity of San Bernardino, Southern California

Metadata also available as - [Outline] - [Parseable text] - [XML]

Frequently anticipated questions:


What does this data set describe?

Title:
Principal Facts for Gravity Stations in the Vicinity of San Bernardino, Southern California
Abstract:
New gravity measurements in the vicinity of San Bernardino, California were collected to help define the characteristics of the Rialto-Colton fault. The data were processed using standard reduction formulas and parameters. Rock properties such as lithology, magnetic susceptibility and density also were measured at several locations.
  1. How might this data set be cited?
    Anderson, M.L., Roberts, C.W., and Jachens, R.C., 2000, Principal Facts for Gravity Stations in the Vicinity of San Bernardino, Southern California: U.S. Geological Survey Open-File Report 00-193, U.S. Geological Survey, Menlo Park, CA.

    Online Links:

  2. What geographic area does the data set cover?
    West_Bounding_Coordinate: -117.625
    East_Bounding_Coordinate: -117.0
    North_Bounding_Coordinate: 34.25
    South_Bounding_Coordinate: 34.0
  3. What does it look like?
    http://pubs.usgs.gov/of/2000/0193/images/coverthb.jpg (JPEG)
    Location map showing faults in the study area. 600x390 pixel 24-bit color.
  4. Does the data set describe conditions during a particular time period?
    Beginning_Date: Dec-1998
    Ending_Date: Nov-1999
    Currentness_Reference:
    Ground condition (time during which stations were established and local measurements made).
  5. What is the general form of this data set?
    Geospatial_Data_Presentation_Form: Tabular data
  6. How does the data set represent geographic features?
    1. How are geographic features stored in the data set?
      This is a Vector data set. It contains the following vector data types (SDTS terminology):
      • Entity Point (611)
    2. What coordinate system is used to represent geographic features?
      Horizontal positions are specified in geographic coordinates, that is, latitude and longitude. Latitudes are given to the nearest 0.01 minutes. Longitudes are given to the nearest 0.01 minutes. Latitude and longitude values are specified in Degrees and decimal minutes. The horizontal datum used is North American Datum of 1927.
      The ellipsoid used is Clarke 1866.
      The semi-major axis of the ellipsoid used is 6378206.4.
      The flattening of the ellipsoid used is 1/294.98.
      Vertical_Coordinate_System_Definition:
      Altitude_System_Definition:
      Altitude_Datum_Name: North American Vertical Datum 1929
      Altitude_Resolution: 0.1
      Altitude_Distance_Units: feet
      Altitude_Encoding_Method: attribute values
  7. How does the data set describe geographic features?
    Entity_and_Attribute_Overview:
    The data files are in ASCII format. The gravity data define point data with information as follows:
    STATION NAME (a8): An alphanumeric combination of up to 8 characters used for station identification;
    LAT (f3.0,f6.3): Latitude in degrees and minutes, to 0.01 minute;
    LON (f4.0,f6.3): Longitude in degrees and minutes, to 0.01 minute;
    ELEV (f8.2): Elevation, to 0.1 ft;
    OG (f10.3): Observed gravity, to 0.01 mGal;
    FAA (f9.3): Free-air anomaly to 0.01 mGal;
    SBA (f8.3): Simple Bouguer anomaly to 0.01 mGal;
    ITC (f7.3): Inner terrain correction for a density of 2.67 g/cm3, to 0.01 mGal, followed by a letter denoting the extent of the correction. "Z" indicates computer terrain correction from the station out to 166.7 km with inner terrain correction out to D zone;
    TC (f7.3): Total terrain correction from the station to 166.7 km for a density of 2.67 g/cm3, to 0.01 mGal;
    TC CODE (a1): Letter denoting the extent of the correction, according to the Hayford-Bowie template (e.g. 'D' means 590 m);
    CBA (f8.3): Complete Bouguer anomaly reduced for a density of 2.67 g/cm3, to 0.01 mGal;
    ISO (f8.3): Isostatic residual anomaly values assuming an Airy model for isostatic compensation of topographic loads. This model assumes a crustal thick ness of 25 km, a topographic load density of 2.67 g/cm3, and a density contrast across the base of the model crust of 0.4 g/cm3;
    The density and susceptibility data define point data with information as follows:
    STATION NAME (a8): An alphanumeric combination of up to 8 characters used for station identification;
    LAT (f3.0,f6.3): Latitude in degrees and minutes, to 0.01 minute;
    LON (f4.0,f6.3): Longitude in degrees and minutes, to 0.01 minute;
    GRAIN DENSITY (f7.2): in grams per cubic centimeter;
    SATURATED BULK DENSITY (f6.2): in grams per cubic centimeter;
    DRY BULK DENSITY (f6.2): in grams per cubic centimeter;
    MAGNETIC SUSCEPTIBILITY (f7.2): in 10-3 cgs units;
    GEOLOGIC MAP UNIT (a10): An alphanumeric combination of up to 10 characters for corresponding geologic map unit when plotted on the 1:24,000 geologic map, see open-file report for map references;
    ROCK TYPE (a32): description of hand sample.
    Entity_and_Attribute_Detail_Citation: http://pubs.usgs.gov/of/2000/0193/pdf/of00-193.pdf

Who produced the data set?

  1. Who are the originators of the data set? (may include formal authors, digital compilers, and editors)
    • M.L. Anderson
    • C.W. Roberts
    • R.C. Jachens
  2. Who also contributed to the data set?
    We would like to thank Jeff Davidson and Geoff Phelps of the USGS for their help gathering field data. We would also like to thank the West San Bernardino County Municipal Water District, the City of Colton, and the City of Rialto for supporting this project. Thanks to Jonathan Matti, Jerry Treiman, and Mike Rymer of the USGS for their tips on geologic and seismic data and James Hunter (Rialto City Public Works) for providing some elevation control data. Field work is not possible without the access provided by the consent of land owners. Thanks to the many unnamed people who allowed us access onto their land and a special thanks to the following helpful people: Al Cunningham and family, Cemex Materials Corp., Richard Scanlan (Rialto Municipal Airport), Lytle Creek Ranger Station, Sally McGill (California State University, San Bernardino), Mike Seal (San Bernardino County Flood Control), Steve Lowe (San Bernardino National Forest), Tom Fujiwara (City of Redlands), and Crafton Hills College.
  3. To whom should users address questions about the data?
    Megan L Anderson
    U.S. Geological Survey
    345 Middlefield Rd, MS 989
    Menlo Park, CA
    USA

    650-329-5308 (voice)
    mlanderson@usgs.gov

Why was the data set created?

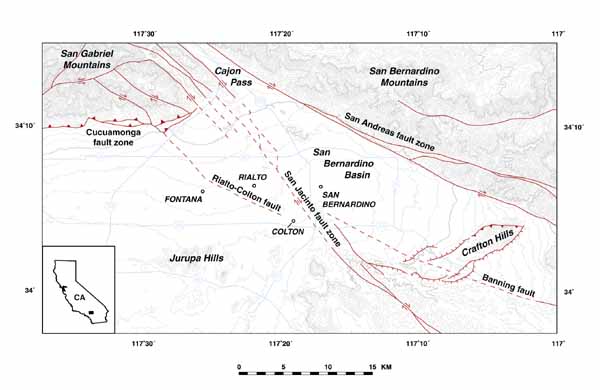
The purpose of the survey was to locate more precisely and characterize the Rialto-Colton fault, a strand in the San Jacinto fault zone. The information developed during this study will be used in ground-water models by the USGS Water Resources Division and for the purposes of deciphering the complex basin geometry and tectonic history in this area to help understand the development of similar strike-slip basins.

How was the data set created?

  1. From what previous works were the data drawn?
  2. How were the data generated, processed, and modified?
    Date: 1999 (process 1 of 3)
    Between December 1998 and November 1999 the U.S. Geological Survey (USGS) established 611 gravity stations in the vicinity of San Bernardino, California.
    Gravity data were processed using factory calibration constants for each meter augmented by correction factors obtained on the Mt. Hamilton calibration loop east of San Jose, CA (Barnes and others, 1969). Observed gravity was calculated based on assumed linear drift between "base ties" (i.e. repeat measurements at our gravity base station during data collection). The data were referenced to the International Gravity Standardization Net 1971 (Morelli, 1974) and the Geodetic Reference System 1967 ellipsoid (International Union of Geodesy and Geophysics, 1971).
    Free-air anomalies were calculated using standard formulas (Swick, 1942). The complete Bouguer anomaly calculation incorporated the Bouguer correction, an earth curvature correction, field-based and computer-generated terrain corrections, and a reduction density of 2.67 g/cm 3 .
    Terrain corrections for the Bouguer correction were calculated in the field up to a radius of 68 m (223 ft) from each station. Terrain corrections from 68 m (223 ft) to 590 m (0.37 mi) were computer calculated using a 30-m Digital Elevations Model (DEM). Terrain corrections out to 166.7 km (100 mi.) were calculated with a computer program by Plouff (1977).
    Terrain corrections for data collected on the premises of the Cemex Materials Corporation (fig. 2; approximately lat 34° 10' N and long 117° 24' N) needed modification because mining operations had significantly changed the topography from that shown on the current 30 m DEM. The DEM was modified with field measurements of the dimensions of the mining pits and 1998 air photos. The DEM was then used to calculate the terrain corrections.
    Isostatic corrections were made using an Airy-Heiskanen model of isostatic compensation (Heiskanen and Vening-Meinesz, 1958). The depth of the crust-mantle boundary was controlled using the following parameters: a crustal thickness at sea level of 25 km, a density contrast of 0.40 g/cm 3 between the crust and the mantle, and a crustal density of 2.67 g/cm 3 (Jachens and Griscom, 1985).
    Date: 1999 (process 2 of 3)
    Along with gravity measurements, rock samples and rock property measurements were collected. These measurements will aid in future gravity modeling and gravity inversion calculations. Samples were brought back to the laboratory and the densities were measured on a precision electronic balance. Grain density, saturated bulk density, and dry bulk density were measured for each sample. Magnetic susceptibilities were measured both in the field and in the laboratory using a Geophysica KT-5 susceptibility meter.
    Date: 16-May-2000 (process 3 of 3)
    Creation of original metadata record Person who carried out this activity:
    Megan L Anderson
    U.S. Geological Survey
    345 Middlefield Rd, MS 989
    Menlo Park, CA
    USA

    650-329-5308 (voice)
    mlanderson@usgs.gov
  3. What similar or related data should the user be aware of?
    Tang, R.W., and Ponce, D.A., 1982, Principal facts, accuracies, sources, and base station descriptions for 4915 gravity stations on the San Bernardino 1°x2° quadrangle, California: U.S. Geological Survey Open-File Report 82-004.

    Sikora, R.F., Langenheim, V.E., Biehler, Shawn, Beyer, L.A., and Chapman, R.H., 1993, Principal facts and base station descriptions for gravity data compiled for the Santa Ana 1° by 2° quadrangle, California: U.S. Geological Survey Open-File Report 93-217A,B.


How reliable are the data; what problems remain in the data set?

  1. How well have the observations been checked?
    Observed gravity data are accurate to 0.05 mGal; reduced anomalies are accurate to 1-2 mGal. Data are more accurate in the flat areas than in the mountains because of uncertainties in the terrain correction. Terrain corrections are accurate to 0.2 mGal in the flat areas and to 0.4-1.5 mGal in the mountains. Grain density measurements are accurate to 0.01 g/cm3; susceptibility measurements to 0.01 x 10⁻³ cgs units.
  2. How accurate are the geographic locations?
    Accuracy of the point data is roughly 10m.
  3. How accurate are the heights or depths?
    Accuracy of the point data is roughly 5-10cm.
  4. Where are the gaps in the data? What is missing?
    Dataset based on geophysical analysis.
  5. How consistent are the relationships among the observations, including topology?
    Sources of error in our data set encompass several aspects. Elevation uncertainty of 5-10 cm (2-4 in) causes an uncertainty in the Bouguer and isostatic anomalies that is typically 0.01- 0.02 mGal. There is some uncertainty in observed gravity from our assumptions of meter drift, though our system of base ties keeps this uncertainty typically less than 0.05 mGal. Our largest source of uncertainty is in the terrain corrections. Our terrain corrections are estimated to be accurate to within 10% of the value of the correction. Therefore, there is very little uncertainty in the values for our stations located on the flats of the San Bernardino basin (typically 0.2 mGal or less), but there is a larger uncertainty associated with the stations in the surrounding mountains and hills (0.4-1.5 mGal), because the terrain corrections are much higher.
    Our data across the Rialto-Colton fault are quite uniform; contouring yields a smooth, consistent, linear gradient that indicates that the error for the data over the Rialto-Colton fault is probably much less than the maximum error given above. Also, data obtained from other agencies and surveys fits in very well with our newly acquired data. In cases where there was a misfit, we analyzed all involved data sets for possible sources of error and corrected them if possible. In a couple of cases, we double-checked our corrections on older data sets by reoccupying several previously established stations. The contour gravity maps (figs. 6 and 7) include data sets from the following surveys/agencies: 114 stations from the Defense Mapping Agency, 940 stations from University of California, Riverside (Tang and Ponce, 1982; Sikora and others, 1993), 171 stations from R.H. Chapman (written commun.; Tang and Ponce, 1982), 86 USGS stations, 102 stations from J.L. McWhirter (Tang and Ponce, 1982), 12 stations from R.B Grannell and R.B. Greenwood (Tang and Ponce, 1982), 449 stations from Tien-Chang Lee (written commun., 1998), and 2 stations from the California high-precision gravity network (Roberts and Jachens, 1986).

How can someone get a copy of the data set?

Are there legal restrictions on access or use of the data?
Access_Constraints: none
Use_Constraints: none
  1. Who distributes the data set? (Distributor 1 of 1)
    Megan L Anderson
    U.S. Geological Survey
    345 Middlefield Rd, MS 989
    Menlo Park, CA
    USA

    650-329-5308 (voice)
    mlanderson@usgs.gov
  2. What's the catalog number I need to order this data set? USGS Open-File Report 00-193
  3. What legal disclaimers am I supposed to read?
    This report is preliminary and has not been reviewed for conformity with U.S. Geological Survey editorial standards or with the North American Stratigraphic Code. Any use of trade, firm, or product names is for descriptive purposes only and does not imply endorsement by the U.S. Government.
  4. How can I download or order the data?
    • Availability in digital form:
      Data format: Gravity station data and physical properties of samples in format Columnar text Fixed-field ASCII; FORTRAN format statement descriptors for the field names (in this order) are
      for Gravity station file:
      STATION NAME (a8)
      LAT (f3.0,f6.3)
      LON (f4.0,f6.3)
      ELEV (f8.2)
      OG (f10.3)
      FAA (f9.3)
      SBA (f8.3)
      ITC (f7.3)
      TC (f7.3)
      TC CODE (a1)
      CBA (f8.3)
      ISO (f8.3)
      
      for Physical properties file:
      STATION NAME (a8)
      LAT (f3.0,f6.3)
      LON (f4.0,f6.3)
      GRAIN DENSITY (f7.2)
      SATURATED BULK DENSITY (f6.2)
      DRY BULK DENSITY (f6.2)
      MAGNETIC SUSCEPTIBILITY (f7.2)
      GEOLOGIC MAP UNIT (a10)
      ROCK TYPE (a32)
      
      Size: 0.05
      Network links: http://pubs.usgs.gov/of/2000/0193/sb-gravity-of00-193.txt
      http://pubs.usgs.gov/of/2000/0193/sb-prop-of00-193.txt
    • Cost to order the data: none


Who wrote the metadata?

Dates:
Last modified: 10-Jun-2016
Metadata author:
Peter N Schweitzer
USGS Midwest Area
Collection manager, USGS Geoscience Data Clearinghouse, http://geo-nsdi.er.usgs.gov/
Mail Stop 954
12201 Sunrise Valley Dr
Reston, VA
USA

703-648-6533 (voice)
703-648-6252 (FAX)
pschweitzer@usgs.gov
Metadata standard:
Content Standard for Digital Geospatial Metadata (FGDC-STD-001-1998)

This page is <https://geo-nsdi.er.usgs.gov/metadata/open-file/00-193/metadata.faq.html>
Generated by mp version 2.9.48 on Tue Jul 03 20:05:23 2018