Citation:
Citation_Information:
Originator: Pike, Richard J.
Originator: Graymer, Russell W.
Originator: Roberts, Sebastian
Originator: Kalman, Naomi B.
Originator: Sobieszczyk, Steven
Publication_Date: 2001
Title:
Map and map database of susceptibility to slope failure by
sliding and earthflow in the Oakland area, California
Edition: 1.0
Geospatial_Data_Presentation_Form: map
Series_Information:
Series_Name: U.S. Geological Survey Miscellaneous Field Studies Map
Issue_Identification: MF-2385
Publication_Information:
Publication_Place: Menlo Park, CA
Publisher: U.S. Geological Survey
Online_Linkage: http://pubs.usgs.gov/mf/2002/2385/
Description:
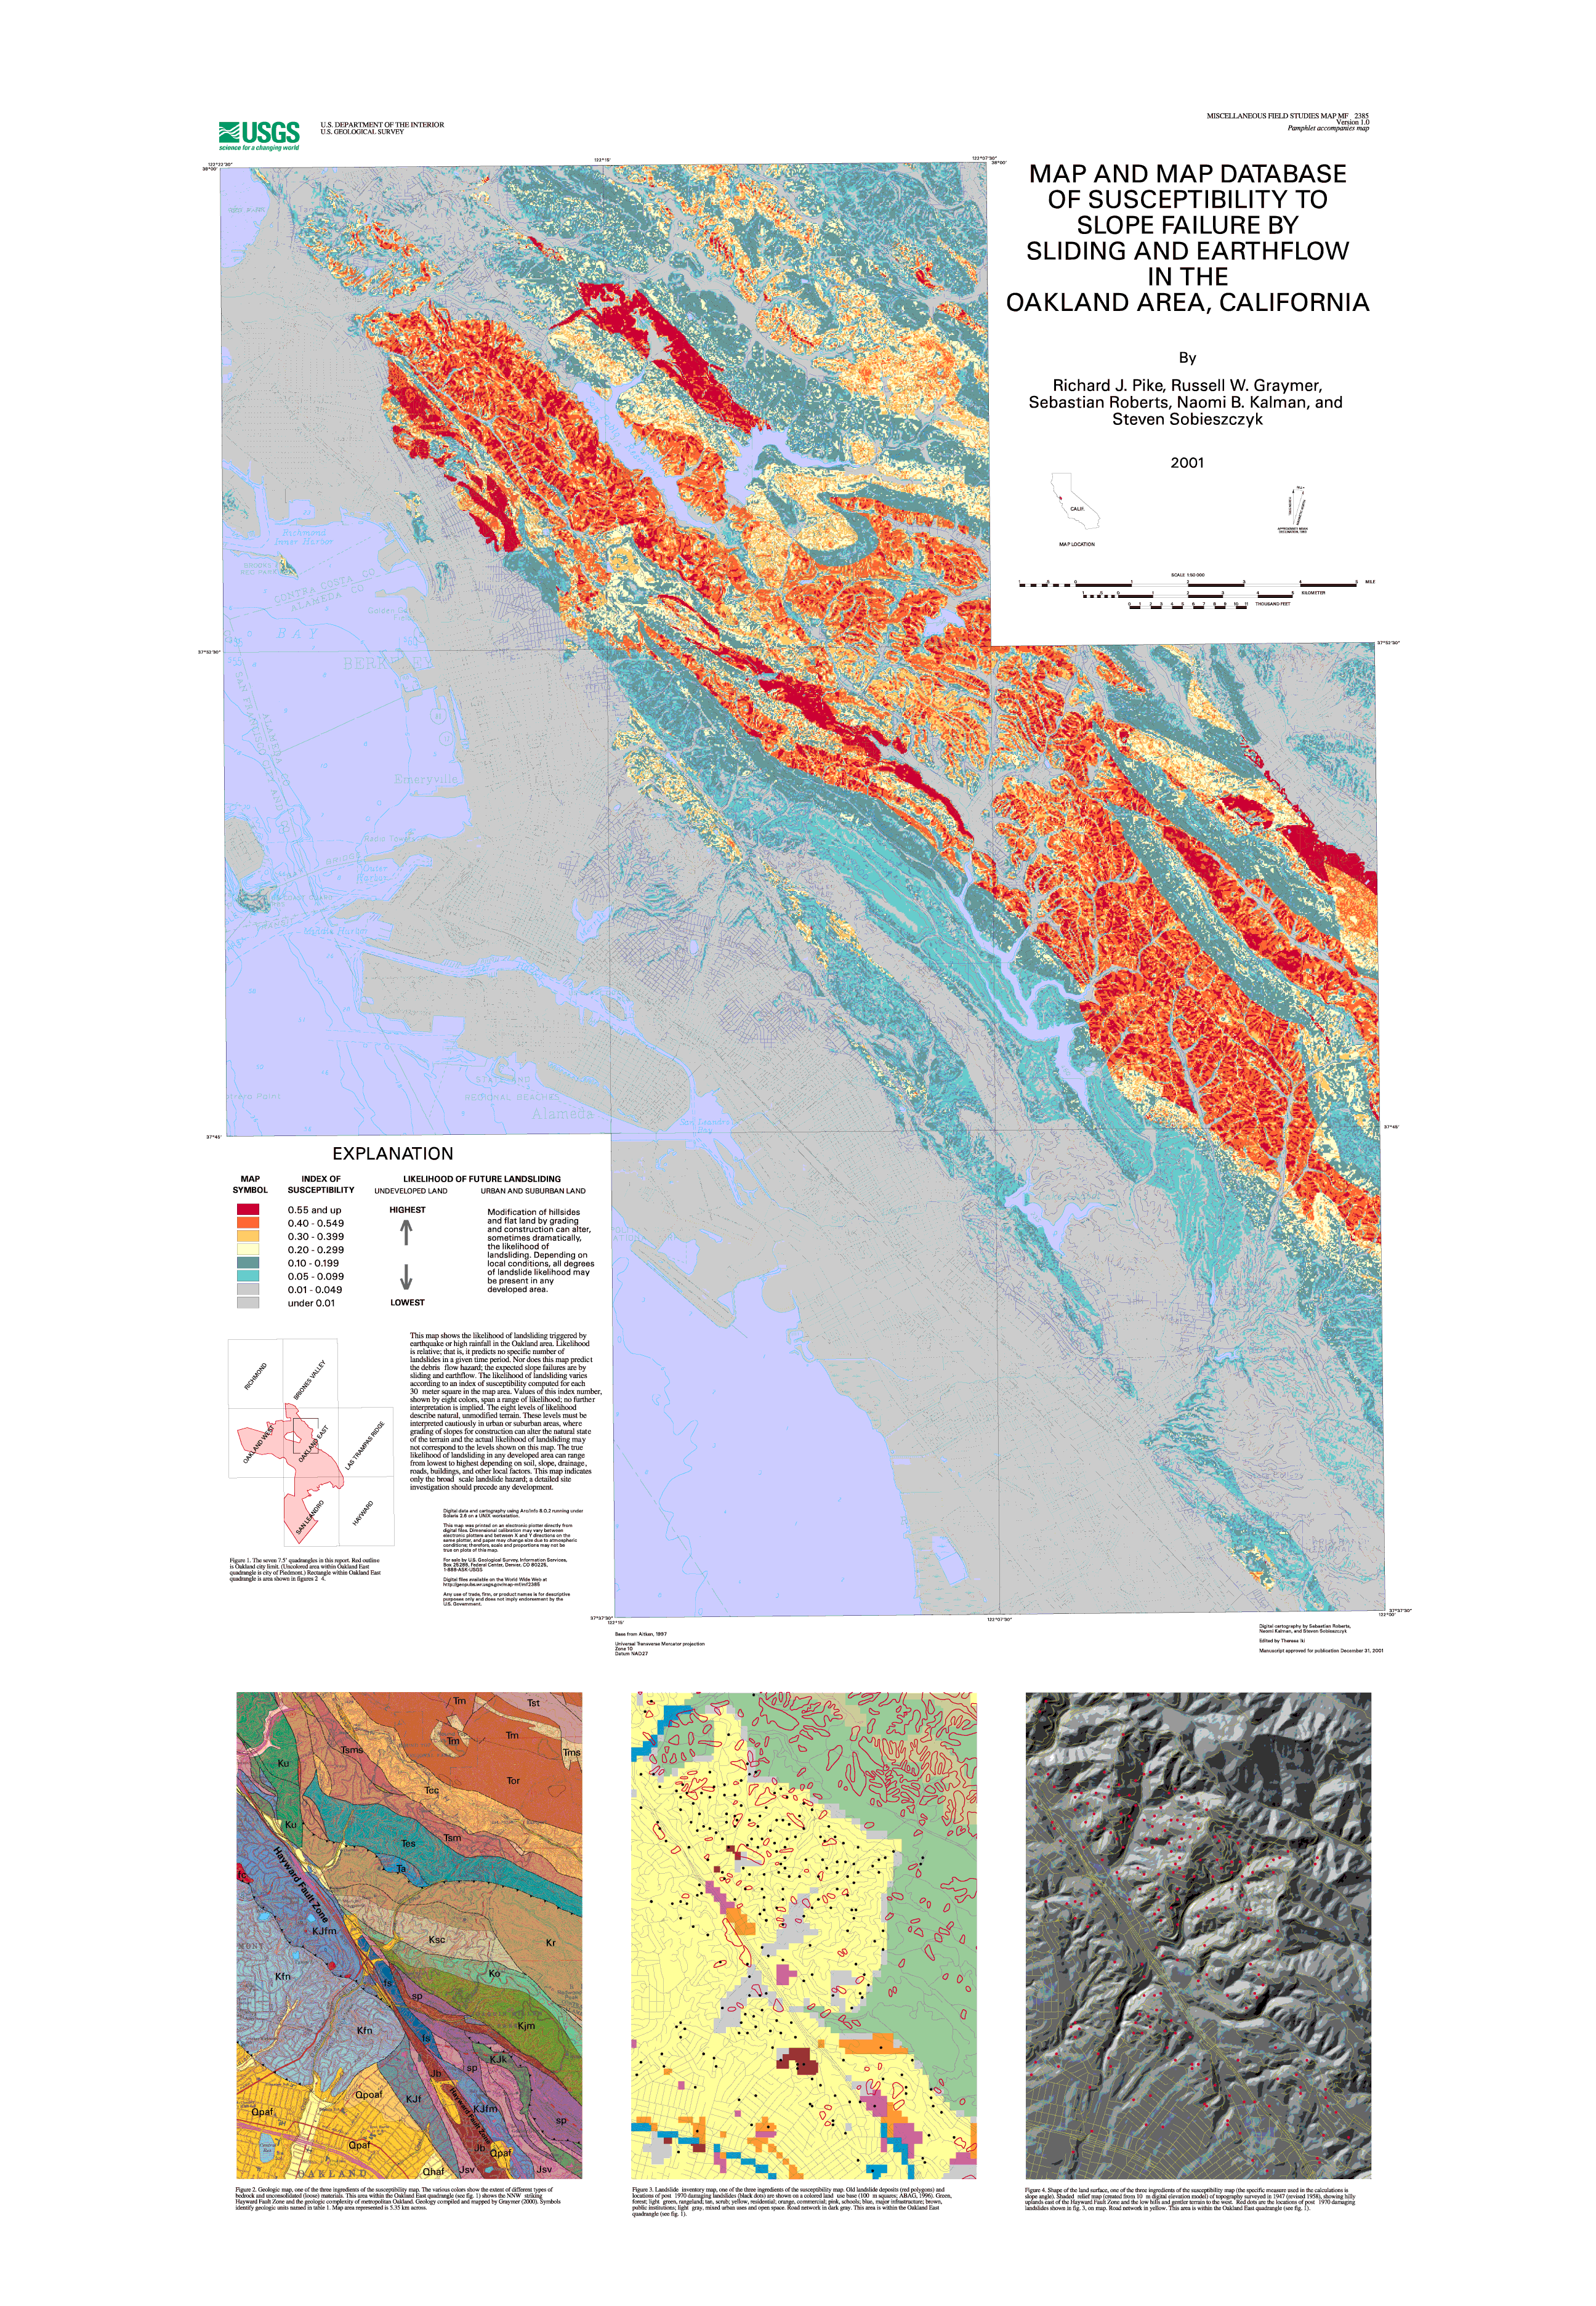
Abstract:
Map data that predict the varying likelihood of landsliding can
help public agencies make informed decisions on land use and
zoning. This map, prepared in a geographic information system
from a statistical model, estimates the relative likelihood of
local slopes to fail by two processes common to an area of
diverse geology, terrain, and land use centered on metropolitan
Oakland. The model combines the following spatial data: (1) 120
bedrock and surficial geologic-map units, (2) ground slope
calculated from a 30-m digital elevation model, (3) an inventory
of 6,714 old landslide deposits (not distinguished by age or type
of movement and excluding debris flows), and (4) the locations of
1,192 post-1970 landslides that damaged the built environment.
The resulting index of likelihood, or susceptibility, plotted as
a 1:50,000-scale map, is computed as a continuous variable over a
large area (872 km2) at a comparatively fine (30 m) resolution.
This new model complements landslide inventories by estimating
susceptibility between existing landslide deposits, and improves
upon prior susceptibility maps by quantifying the degree of
susceptibility within those deposits.
Susceptibility is defined for each geologic-map unit as the
spatial frequency (areal percentage) of terrain occupied by old
landslide deposits, adjusted locally by steepness of the
topography. Susceptibility of terrain between the old landslide
deposits is read directly from a slope histogram for each
geologic-map unit, as the percentage (0.00 to 0.90) of 30-m cells
in each one-degree slope interval that coincides with the
deposits.
Susceptibility within landslide deposits (0.00 to 1.33) is this
same percentage raised by a multiplier (1.33) derived from the
comparative frequency of recent failures within and outside the
old deposits. Positive results from two evaluations of the model
encourage its extension to the 10-county San Francisco Bay region
and elsewhere. A similar map could be prepared for any area
where the three basic constituents, a geologic map, a landslide
inventory, and a slope map, are available in digital form. Added
predictive power of the new susceptibility model may reside in
attributes that remain to be explored-among them seismic shaking,
distance to nearest road, and terrain elevation, aspect, relief,
and curvature.
Purpose:
Mitigation is superior to post-disaster response in reducing the
billions of dollars in losses resulting from U.S. natural
disasters, and information that predicts the varying likelihood
of geologic hazards can help public agencies improves the
necessary decision making on land use and zoning. Accordingly,
this map was created to increase the resistance of one urban
area, metropolitan Oakland, California, to landsliding. Prepared
in a geographic information system from a statistical model, the
map estimates the relative likelihood of local slopes to fail by
two processes common to this area of diverse geology, terrain,
and land use.
Time_Period_of_Content:
Time_Period_Information:
Single_Date/Time:
Calendar_Date: 2001
Currentness_Reference:
The date given is the publication date. The information in the
report is the most up-to-date available at the time of
publication.
Status:
Progress: Complete
Maintenance_and_Update_Frequency: As needed
Spatial_Domain:
Bounding_Coordinates:
West_Bounding_Coordinate: -122.3750000
East_Bounding_Coordinate: -122.0000000
North_Bounding_Coordinate: 38.00000000
South_Bounding_Coordinate: 37.62500000
Keywords:
Theme:
Theme_Keyword_Thesaurus: USGS Thesaurus
Theme_Keyword: landslides
Theme_Keyword: landslide susceptiblity assessment
Theme_Keyword: geology
Theme_Keyword: geologic maps
Theme_Keyword: hazards
Theme_Keyword: land surface characteristics
Theme_Keyword: earthquakes
Theme_Keyword: geospatial datasets
Theme:
Theme_Keyword_Thesaurus: none
Theme_Keyword: landslide
Theme_Keyword: susceptiblity
Theme_Keyword: earthflow
Theme_Keyword: mass movement
Theme_Keyword: hazard
Theme_Keyword: debris flow
Theme_Keyword: slope
Theme_Keyword: failure
Theme_Keyword: slide
Theme_Keyword: earthquake
Theme_Keyword: el nino
Theme_Keyword: thunderstorm
Theme_Keyword: usgs
Theme_Keyword: fema
Theme_Keyword: cdmg
Theme:
Theme_Keyword_Thesaurus: ISO 19115 Topic Categories
Theme_Keyword: geoscientificInformation
Place:
Place_Keyword_Thesaurus: none
Place_Keyword: United States of America
Place_Keyword: California
Place_Keyword: Oakland
Place_Keyword: Berkeley
Place_Keyword: Piedmont
Place:
Place_Keyword_Thesaurus: Augmented FIPS 10-4 and FIPS 6-4
Place_Keyword: f06001 = Alameda
Place_Keyword: f06013 = Contra Costa
Access_Constraints: None
Use_Constraints:
Uses of this digital landslide susceptiblity map should not violate the
spatial resolution of the data. Although the digital form of the data removes
the constraint imposed by the scale of a paper map, the detail and accuracy
inherent in map scale are also present in the digital data. The fact that
this database was edited for a scale of 1:50,000 means that higher resolution
information, greater than 30 meter cell size, is not present in the dataset.
Plotting at scales larger than 1:50,000 (30m cell size) will not yield greater
real detail, although it may reveal fine-scale irregularities below the
intended resolution of the database. Similarly, where this database is used
in combination with other data of higher resolution, the resolution of the
combined output will be limited by the lower resolution of these data.
Point_of_Contact:
Contact_Information:
Contact_Person_Primary:
Contact_Person: Richard J Pike
Contact_Organization: U.S. Geological Survey, GEO-WRG-NGM
Contact_Address:
Address_Type: mailing address
Address:
Mail Stop 975
345 Middlefield Road
City: Menlo Park
State_or_Province: CA
Postal_Code: 94025
Country: USA
Contact_Voice_Telephone: 650-329-4947
Contact_Facsimile_Telephone: 650-329-4936
Contact_Electronic_Mail_Address: [email protected]
Browse_Graphic:
Browse_Graphic:
Browse_Graphic_File_Name: http://pubs.usgs.gov/mf/2002/2385/mf-2385_6b.pdf
Browse_Graphic_File_Description:
A PDF representation of the geologic map and base maps at a scale of
1:50,000 (Sheet 1). 13 megabytes.
Browse_Graphic_File_Type: PDF
Data_Set_Credit:
Richard J. Pike (USGS) co-conceived the project and directed the
overall effort, supplied ideas and topographic parameters to be
experimented with by Sebastian Roberts, contributed to creating (
with Scott Graham, USGS) the 30-m digital elevation model, devised
the final model, prepared the tables, decided on figures to be
made, chose colors for map, and prepared all versions of the
pamphlet text and designed its final layout.
Russell W. Graymer (USGS) co-conceived the project and delimited
the study area, supplied ideas to be experimented with by S.
Roberts, furnished the digital geologic map and list of 120 map
units, devised the first model for within-landslide susceptibility,
conceived the tests of the model-particularly normalization of the
post-1970 landslide data, and contributed to the pamphlet.
Sebastian Roberts (USGS and Environmental Careers Organization)
digitized the original 1:24,000-scale landslide maps and map
positions of the post-1970 landslides, compiled the digital data on
geology, ground slope, landslide inventory, recent landsliding, and
land use in the Arc/Info geographic information system, wrote the
Arc Macro Language (AML) to make computations, computed the first
set of susceptibility values, and created the earliest versions of
the 1:50,000-scale color map.
Naomi B. Kalman (USGS and Environmental Careers Organization)
recompiled data, adjusted the susceptibility and plot AMLs,
computed the revised set of susceptibility values, made preliminary
versions of pamphlet figures, based off her database files,
produced intermediate versions of the map, and served as a resource
for later work on the project.
Steven Sobieszczyk (USGS and Environmental Careers Organization)
recompiled some of the data, rewrote the plot AML, computed the
revised susceptibility values, created or modified color and
monochrome illustrations for the map and pamphlet, prepared the
final versions of the map, annotated and reformatted the map to
conform to USGS publication standards, and made corrections to the
map after technical reviews. He wrote the metadata for the digital
file, and helped format the pamphlet to conform to USGS publication
standards.
Native_Data_Set_Environment: SunOS, 5.5.1, sun4u UNIX, ARC/INFO version 7.2.1