Quaternary geology of Contra Costa County, and surrounding parts of Alameda, Marin, Sonoma, Solano, Sacramento, and San Joaquin Counties, California: A digital database

Metadata also available as - [Outline] - [Parseable text] - [XML]

Frequently anticipated questions:


What does this data set describe?

Title:
Quaternary geology of Contra Costa County, and surrounding parts of Alameda, Marin, Sonoma, Solano, Sacramento, and San Joaquin Counties, California: A digital database
Abstract:
Contra Costa County is located at the northern end of the Diablo Range of Central California. It is bounded on the north by Carquinez Strait, through which flows 27 percent of California's surface water runoff. San Francisco Bay forms the western boundary, the San Joaquin Valley borders it on the east and the Livermore Valley forms the southern boundary. Contra Costa is one of the nine Bay Area counties with streams that are tributaries to San Francisco Bay. Most of the county is mountainous with steep rugged topography. Mount Diablo, in the center of the county, is one of the highest peaks in the Bay Area, reaching an elevation of 1173 meters (3,849 ft). Contra Costa County is covered by twenty-five 7.5' topographic Quadrangles shown on the index map (ccq_quad or Sheet 2). However, two of the quadrangles (Hayward and Petaluma Point) contain no Quaternary deposits in Contra Costa County, and so are not discussed herein.
The Quaternary deposits in Contra Costa County comprise two distinct depositional environments. One, forming a transgressive sequence of alluvial fan and fan-delta deposits, is mapped in the western four-fifths of the county. The second, forming a combination of eolian dune and river delta deposits, is mapped in the San Joaquin Valley in the eastern part of the county.
  1. How might this data set be cited?
    Helley, E.J., and Graymer, R.W., 1997, Quaternary geology of Contra Costa County, and surrounding parts of Alameda, Marin, Sonoma, Solano, Sacramento, and San Joaquin Counties, California: A digital database: U.S. Geological Survey Open-File Report 97-98.

    Online Links:

  2. What geographic area does the data set cover?
    West_Bounding_Coordinate: -122.5
    East_Bounding_Coordinate: -121.5
    North_Bounding_Coordinate: 38.13
    South_Bounding_Coordinate: 37.63
  3. What does it look like?
    http://pubs.usgs.gov/of/1997/of97-098/ccqmap.jpg (JPG)
    Reduced size image of the entire map sheet, 793x684 pixels, 240k bytes
    http://pubs.usgs.gov/of/1997/of97-098/ccqmap.pdf (PDF)
    PDF representation of geologic map sheet
  4. Does the data set describe conditions during a particular time period?
    Calendar_Date: 1997
    Currentness_Reference:
    publication date
  5. What is the general form of this data set?
    Geospatial_Data_Presentation_Form: map
  6. How does the data set represent geographic features?
    1. How are geographic features stored in the data set?
      This is a vector data set. It contains the following vector data types (SDTS terminology):
      • entity point
      • complete chain
      • GT-polygon composed of chains
    2. What coordinate system is used to represent geographic features?
      State_Plane_Coordinate_System:
      SPCS_Zone_Identifier: 3326
      Lambert_Conformal_Conic:
      Standard_Parallel: 37.066667
      Standard_Parallel: 38.433333
      Longitude_of_Central_Meridian: -120.5
      Latitude_of_Projection_Origin: 36.5
      False_Easting: 609601.219202
      False_Northing: 0.0
      Planar coordinates are encoded using coordinate pair
      Planar coordinates are specified in meters
      The horizontal datum used is North American Datum of 1927.
      The ellipsoid used is Clarke 1866.
      The semi-major axis of the ellipsoid used is 6378206.4.
      The flattening of the ellipsoid used is 1/294.98.
  7. How does the data set describe geographic features?
    Entity_and_Attribute_Overview:
    ARC/INFO export files	Description of coverage
    
    an_sp-py.e00           Quaternary geology in Antioch North quadrangle
    as_sp-py.e00           Antioch South quadrangle
    be_sp-py.e00           Benicia quadrangle
    bh_sp-py.e00           Byron Hot Springs quadrangle
    bi_sp-py.e00           Bouldin Island quadrangle
    bv_sp-py.e00           Briones Valley quadrangle
    bw_sp-py.e00           Brentwood quadrangle
    cf_sp-py.e00           Clifton Court Forebay quadrangle
    cl_sp-py.e00           Clayton quadrangle
    di_sp-py.e00           Diablo quadrangle
    du_sp-py.e00           Dublin quadrangle
    hb_sp-py.e00           Honker Bay quadrangle
    ji_sp-py.e00           Jersey Island quadrangle
    lt_sp-py.e00           Las Trampas Ridge quadrangle
    lv_sp-py.e00           Livermore quadrangle
    mi_sp-py.e00           Mare Island quadrangle
    oe_sp-py.e00           Oakland East quadrangle
    ri_sp-py.e00           Richmond quadrangle
    sq_sp-py.e00           San Quentin quadrangle
    ta_sp-py.e00           Tassajara quadrangle
    vh_sp-py.e00           Vine Hill quadrangle
    wc_sp-py.e00           Walnut Creek quadrangle
    wi_sp-py.e00           Woodward Island quadrangle
    ccq_quad.e00           Index map of quadrangles in Contra Costa County
    ccq_corr.e00           Correlation table for the units in this map database
    cc_dr-sp.e00           Drainage base map (from 1:100,000 scale originals)
    cc_cu-sp.e00           Cultural base map (from 1:100,000 scale originals)
    cc_topo-sp.e00         Topographic contours base map (from 1:100,000 scale originals
    
    Entity_and_Attribute_Detail_Citation: http://pubs.usgs.gov/of/1997/of97-098/ccqgeo.txt

Who produced the data set?

  1. Who are the originators of the data set? (may include formal authors, digital compilers, and editors)
    • E.J. Helley
    • R.W. Graymer
  2. Who also contributed to the data set?
  3. To whom should users address questions about the data?
    Graymer, Russell W
    USGS-GEO-WRG-NGM
    Mail Stop 975, USGS
    345 Middlefield Road
    Menlo Park, CA
    US

    650-329-4988 (voice)
    rgraymer@usgs.gov

Why was the data set created?

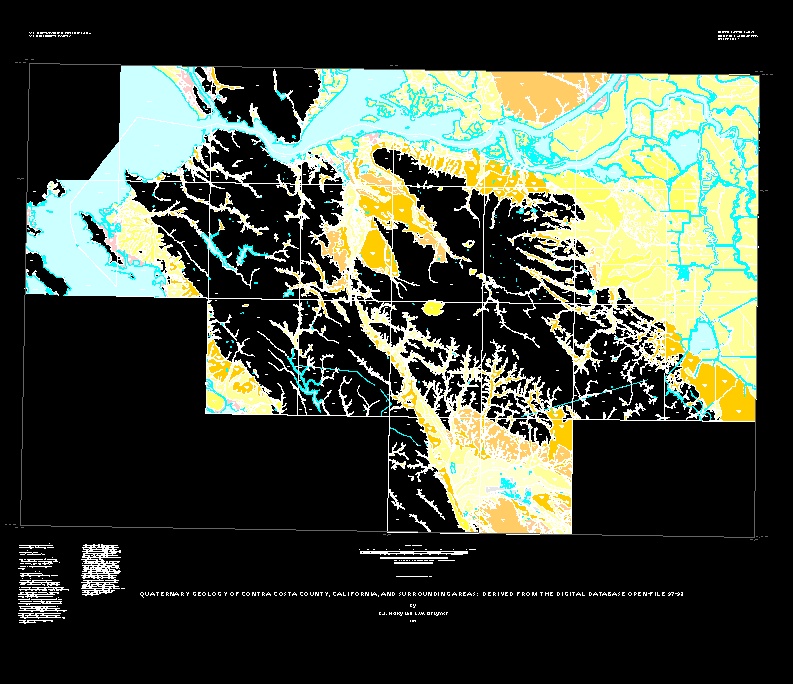
This digital geologic map database provides current information on the Quaternary stratigraphy of the area covered.

How was the data set created?

  1. From what previous works were the data drawn?
  2. How were the data generated, processed, and modified?
    Date: unknown (process 1 of 2)
    Mapping Methods
    Geological units were mapped on 1:24,000 scale U.S. Geological Survey topographic maps using 1939 black and white aerial photographs showing the county before much development had taken place. The mapping was supplemented with 1:12,000- and 1:24,000-scale color aerial photography flown in 1965 and 1974 respectively. The mapping was also aided by observations made on turn of the century topographic maps at 1:62,500-scale with 25 foot (7.6 m) contour intervals. These maps were most useful in recognizing natural stream channels which have since been modified. The position of water boundaries, the stream channel to water transition, the length and position of mapped stream channels (see below), the distribution of artificial levees, and the apparent distribution of artificial fill were plotted to conform with the most recent 1:24,000 scale topographic maps.
    Mapping units were delineated by: 1) landform morphology, 2) relative topographic position, 3) relative preservation of surface morphology, 4) tonal contrasts on aerial photographs, 5) relative soil profile development (compiled from the U.S. Soil Conservation Service, 1917), and 6) other features such as differences in vegetation density and type. Landform morphology refers to the shape of a particular landscape element. Examples are the distinctive conical shape of alluvial fans and the shape of levees that usually border active stream channels, sloping away from them to blend into flat basin deposits. Other criteria listed in the description of geological units are also used to distinguish one element from another, but they are particularly useful for delineating units within a specific landscape element.
    Digital Compilation
    The geologic map information was digitized from stable originals of the geologic maps at 1:24,000 scale. The author manuscripts (pencil on mylar) were scanned using a Altek monochrome scanner with a resolution of 800 dots per inch. The scanned images were vectorized and transformed from scanner coordinates to projection coordinates with digital tics placed by hand at quadrangle corners. The scanned lines were edited interactively by hand using ALACARTE, color boundaries were tagged as appropriate, and scanning artifacts visible at 1:24,000 were removed.
    Base Maps
    Base Map layers were prepared from scale-stable printing negatives of the U.S. Geological Survey San Francisco (1978 edition), Stockton (1989 edition), Napa (1983 edition), and Lodi (1993 edition) 1:100,000 topographic maps, which have a 50 meter contour interval. Scanned and vectorized images were transformed from scanner coordinates to projection coordinates with digital tics placed by hand at map corners. The images were then trimmed interactively by hand using ALACARTE to conform to the area of the geologic coverages, and the four portions were combined.
    Date: 22-May-2009 (process 2 of 2)
    Creation of original metadata record Person who carried out this activity:
    Jennifer Lenz
    US Geological Survey
    12201 Surise Valley Drive, Mail Stop 918
    Reston, VA
    USA

    703-648-6974 (voice)
    703-648-6560 (FAX)
    pschweitzer@usgs.gov
  3. What similar or related data should the user be aware of?

How reliable are the data; what problems remain in the data set?

  1. How well have the observations been checked?
  2. How accurate are the geographic locations?
    The geological units shown on this map provide information on texture, environment of deposition, and age. The contacts between units are, in most cases, not sharp but diffuse and may span a few meters.
  3. How accurate are the heights or depths?
  4. Where are the gaps in the data? What is missing?
    No bedrock units have been mapped; bedrock outcrop is simply labeled "br". Other geologic features, such as folds and faults, have not been mapped. A few large landslides are shown, but this map does not show most of the landslides in the area.
  5. How consistent are the relationships among the observations, including topology?
    This digital map database, compiled from previously unpublished data, and new mapping by the authors, represents the general distribution of surficial deposits in Contra Costa County and surrounding areas.

How can someone get a copy of the data set?

Are there legal restrictions on access or use of the data?
Access_Constraints: none
Use_Constraints: none
  1. Who distributes the data set? (Distributor 1 of 1)
    USGS Information Services
    Box 25286, Denver Federal Center
    Denver, Colorado
    USA

    1-888-ASK-USGS (voice)
    1-303-202-4695 (FAX)
    infoservices@usgs.gov
  2. What's the catalog number I need to order this data set? US Geological Survey Open-File Report 97-98
  3. What legal disclaimers am I supposed to read?
    This report is preliminary and has not been reviewed for conformity with U.S. Geological Survey editorial standards or with the North American Stratigraphic Code. Any use of trade, product, or firm names is for descriptive purposes only and does not imply endorsement by the U.S. Government.This database, identified as "Quaternary geology of Contra Costa County, and surrounding parts of Alameda, Marin, Sonoma, Solano, Sacramento, and San Joaquin Counties, California: A digital database," has been approved for release and publication by the Director of the USGS. Although this database has been subjected to rigorous review and is substantially complete, the USGS reserves the right to revise the data pursuant to further analysis and review. Furthermore, it is released on condition that neither the USGS nor the United States Government may be held liable for any damages resulting from its authorized or unauthorized use.
  4. How can I download or order the data?

Who wrote the metadata?

Dates:
Last modified: 05-Feb-2016
Metadata author:
Peter N Schweitzer
USGS Midwest Area
Collection manager, USGS Geoscience Data Clearinghouse, http://geo-nsdi.er.usgs.gov/
Mail Stop 954
12201 Sunrise Valley Dr
Reston, VA
USA

703-648-6533 (voice)
703-648-6252 (FAX)
pschweitzer@usgs.gov
Metadata standard:
Content Standard for Digital Geospatial Metadata (FGDC-STD-001-1998)

This page is <https://geo-nsdi.er.usgs.gov/metadata/open-file/97-98/metadata.faq.html>
Generated by mp version 2.9.48 on Tue Jul 03 20:07:06 2018