Geologic Map of the Corona South 7.5' Quadrangle, Riverside and Orange Counties, California

Metadata also available as - [Outline] - [Parseable text] - [XML]

Frequently anticipated questions:


What does this data set describe?

Title:
Geologic Map of the Corona South 7.5' Quadrangle, Riverside and Orange Counties, California
Abstract:
This data set maps and describes the geology of the Corona South 7.5' quadrangle, Riverside and Orange Counties, California. Created using Environmental Systems Research Institute's ARC/INFO software, the data base consists of the following items: (1) a map coverage containing geologic contacts and units, (2) a coverage containing structural data, (3) a coverage containing geologic unit annotation and leaders, and (4) attribute tables for geologic units (polygons), contacts (arcs), and site-specific data (points). In addition, the data set includes the following graphic and text products: (1) a postscript graphic plot-file containing the geologic map, topography, cultural data, a Correlation of Map Units (CMU) diagram, a Description of Map Units (DMU), and a key for point and line symbols, and (2) PDF files of the Readme (including the metadata file as an appendix), and the graphic produced by the Postscript plot file.
The Corona South quadrangle is located near the northern end of the Peninsular Ranges Province. Diagonally crossing the quadrangle is the northern end of the Elsinore Fault zone, a major active right-lateral strike-slip fault zone of the San Andreas Fault system. East of the fault zone is the Perris block and to the west the Santa Ana Mountains block. Basement in the Perris block part of the quadrangle is almost entirely Cretaceous volcanic rocks and granitic rocks of the Cretaceous Peninsular Ranges batholith. Three small exposures of very low metamorphic grade siliceous rocks correlated on the basis of lithology with Mesozoic age rocks are located near the eastern edge of the quadrangle. Exposures of batholithic rocks is restricted to mostly granodiorite of the Cajalco pluton that underlies extensive areas to the east and north. There are limited amounts of undifferentiated granitic rock and one small body of gabbro. The most extensive basement rocks are volcanic shallow intrusives and extrusives of the Estelle Mountain volcanics. The volcanics, predominantly latite and rhyolite, are quarried as a source of crushed rock.
West of the Elsinore Fault zone is a thick section of Bedford Canyon Formation of Jurassic age. This unit consists of incipiently metamorphosed marine sedimentary rocks consisting of argillite, slate, graywacke, impure quartzite, and small pods of limestone. Bedding and other primary sedimentary structures are commonly preserved and tight folds are common. Incipiently developed transposed layering, S1, is locally well developed. Included within the siliceous rocks are small outcrops of fossiliferous limestone than contain a fauna indicating the limestone formed in a so-called black smoker environment. Unconformably overlying and intruding the Bedford Canyon Formation is the Santiago Peak Volcanics of Cretaceous age. These volcanics consist of basaltic andesite, andesite, dacite, rhyolite, breccia and volcanoclastic rocks. Much of the unit has been hydrothermally altered; the alteration was contemporaneous with the volcanism. A minor occurrence of serpentine and associated silica-carbonate rock occurs in association with the volcanics.
Sedimentary rocks of late Cretaceous and Paleogene age and a few Neogene age rocks occur within the Elsinore Fault zone. Marine sandstone of the middle Miocene Topanga Formation occurs within the fault zone southeast of Corona. Underlying the Topanga Formation is the nonmarine undivided Sespe and Vaqueros Formation that are predominantly sandstone. Sandstone, siltstone, and conglomerate of the marine and nonmarine Paleocene Silverado Formation extends essentially along the entire length of the fault zone in the quadrangle. Clay beds in the Silverado Formation have been an important source of clay. In the northwest corner of the quadrangle is a thick, faulted, sedimentary section that ranges in age from Cretaceous to early Pliocene-Miocene.
Emanating from the Santa Ana Mountains is an extensive alluvial fan complex that underlies Corona and the surrounding valleys. This fan complex includes both Pleistocene and Holocene age deposits.
The Elsinore Fault zone at the base of the Santa Ana Mountains splays in the northwestern part of the quadrangle; beyond the quadrangle boundary the name Elsinore Fault is generally not used. The southern splay takes a more western trend and to the west of the quadrangle is termed the Whittier Fault, a major active fault. The eastern splay continues on strike along the east side of the Chino (Puente) Hills north of the quadrangle where it is termed the Chino Fault. The Chino Fault appears to have very limited displacement.
The geologic map data base contains original U.S. Geological Survey data generated by detailed field observation recorded on 1:24,000 scale aerial photographs. The map was created by transferring lines from the aerial photographs to a 1:24,000 scale topographic base. The map was digitized and lines, points, and polygons were subsequently edited using standard ARC/INFO commands. Digitizing and editing artifacts significant enough to display at a scale of 1:24,000 were corrected. Within the database, geologic contacts are represented as lines (arcs), geologic units are polygons, and site-specific data as points. Polygon, arc, and point attribute tables (.pat, .aat, and .pat, respectively) uniquely identify each geologic datum.
  1. How might this data set be cited?
    C H. Gray, Jr., Morton, Douglas M., and F. Harold Weber, Jr., 2002, Geologic Map of the Corona South 7.5' Quadrangle, Riverside and Orange Counties, California: U.S. Geological Survey Open-File Report 02-21, U.S. Geological Survey, Menlo Park, California.

    Online Links:

  2. What geographic area does the data set cover?
    West_Bounding_Coordinate: -117.62509096
    East_Bounding_Coordinate: -117.49990904
    North_Bounding_Coordinate: 33.87499995
    South_Bounding_Coordinate: 33.74998418
  3. What does it look like?
    http://pubs.usgs.gov/of/2002/0021/images/crs_map.jpg (JPEG)
    Reduced-size image of the map, 400x535 pixels, 32-bit RGB true color, 82 kbytes.
  4. Does the data set describe conditions during a particular time period?
    Calendar_Date: 2002
    Currentness_Reference:
    publication date
  5. What is the general form of this data set?
    Geospatial_Data_Presentation_Form: vector digital data
  6. How does the data set represent geographic features?
    1. How are geographic features stored in the data set?
      This is a Vector data set. It contains the following vector data types (SDTS terminology):
      • Point (473)
      • String (1556)
      • GT-polygon composed of chains (474)
    2. What coordinate system is used to represent geographic features?
      The map projection used is Polyconic.
      Projection parameters:
      Latitude_of_Projection_Origin: 33.75
      Longitude_of_Central_Meridian: -117.5625
      False_Easting: 0.00000
      False_Northing: 0.00000
      Planar coordinates are encoded using coordinate pair
      Abscissae (x-coordinates) are specified to the nearest 1.000366687774
      Ordinates (y-coordinates) are specified to the nearest 1.000366687774
      Planar coordinates are specified in Meters
      The horizontal datum used is North American Datum of 1927.
      The ellipsoid used is Clarke 1866.
      The semi-major axis of the ellipsoid used is 6378206.4.
      The flattening of the ellipsoid used is 1/294.98.
  7. How does the data set describe geographic features?
    Entity_and_Attribute_Overview:
    Version 1.0 of the Corona South 7.5' quadrangle comprises three ARC/INFO coverages, of which two contain geologic data, and one contains cartographic features: crs_geo (geology), crs_str (structural data), and crs_ano (annotation and leaders).
    Geologic data represented by line entities and the polygons they delineate are contained in the coverage CRS_GEO. For display purposes, the annotation coverage contains two annotation subclasses: anno.geo contains unit labels, anno.fault contains fault names.
    Geological point data includes site-specific information describing the types and the orientation of bedding, foliation, and lineation. Annotation is respective dip and plunge values associated with individual point data.
    CRS_GEO.PAT:
    
    COLUMN   ITEM NAME        WIDTH OUTPUT  TYPE N.DEC  ALTERNATE NAME
        1  AREA                   4    12     F      3
        5  PERIMETER              4    12     F      3
        9  CRS_GEO#               4     5     B      -
       13  CRS_GEO-ID             4     5     B      -
       17  LABL                  35    35     C      -
       52  SHD                    3     3     I      -
       55  PLABL                 35    35     C      -
       90  SHDFIL                 3     3     I      -
       93  NAME                 200   200     C      -
    
    CRS_GEO.AAT:
    
    COLUMN   ITEM NAME        WIDTH OUTPUT  TYPE N.DEC  ALTERNATE NAME
        1  FNODE#                 4     5     B      -
        5  TNODE#                 4     5     B      -
        9  LPOLY#                 4     5     B      -
       13  RPOLY#                 4     5     B      -
       17  LENGTH                 4    12     F      3
       21  CRS_GEO#               4     5     B      -
       25  CRS_GEO-ID             4     5     B      -
       29  LTYPE                 35    35     C      -
       64  L-SYMB                 3     3     I      -
    
    Entity_and_Attribute_Detail_Citation: http://pubs.usgs.gov/of/2002/0021/pdf/README.pdf
    crs_geo.pat
    Geologic units (LABL) and thier corresponding names (NAME) identified in the Corona South 7.5' quadrangle
    LABL
    geologic map unit label, in plain text
    ValueDefinition
    QafArtificial fill
    QywgYoung wash deposits, gravel
    QyfbgYoung alluvial fan deposits, boulder gravel and gravel
    QyfgYoung alluvial fan deposits, gravel
    Qyf1gYoung alluvial fan deposits, Unit 1, gravel
    QyaaYoung alluvial channel deposits, arenaceous
    QyagYoung alluvial channel deposits, gravel
    QylsYoung landslide deposits
    QofOld alluvial fan deposits
    QofaOld alluvial fan deposits, arenaceous
    QofgOld alluvial fan deposits, gravel
    Qof1gOld alluvial fan deposits, Unit 1, gravel
    QolsOld landslide deposits
    QvofgVery old alluvial fan deposits, gravel
    Qvof1gVery old alluvial fan deposits, Unit 1, gravel
    QvoaVery old alluvial channel deposits
    QvoagVery old alluvial channel deposits, gravel
    QTnLate Cenozoic sedimentary rocks in Norco area
    TfFernando Formation
    TpPuente Formation
    TpscSycamore Canyon Member of Puente Formation
    TtTopanga Formation
    TvsVaqueros and Sespe Formations, undifferentiated
    TvssVaqueros, Sespe, Santiago and Silverado Formations, undifferentiated
    TsiSilverado Formation
    KwlWilliams and Ladd Formations, undifferentiated
    KlLadd Formation
    KlhsHolz Shale Member of Ladd Formation
    KlbcBaker Canyon Conglomerate Member of Ladd Formation
    KmpMicropegmatite granite
    KcgMonzogranite of Cajalco Pluton
    KguGranite, undifferentiated
    KhgHeterogeneous granitic rocks
    KtTonalite, undifferentiated
    KgbGabbro
    KsSerpentinite within Santiago Peak Volcanics
    KcCarbonate-silicate rock spatially associated with serpentinite (Ks)
    KvspSantiago Peak Volcanics
    KvspiIntrusive rocks associated with Santiago Peak Volcanics
    KvemEstelle Mountain volcanics of Herzig (1991)
    JbcBedford Canyon Formation
    JbmMarble (limestone) of Bedford Canyon Formation
    MzuMesozoic metasedimentary rocks, undifferentiated
    PLABL
    Geological map unit label used to generate plot labels with relevant stratigraphic symbols. The geologic units with LABL designating Mesozoic (Mz) have keystroke substitute characters, }, that call their corresponding symbols from the Geoage Font Group. Geologic map unit labels will plot on derivative map plots with appropriate stratigraphic symbols if PLABL is used as the source for unit labels.
    SHD
    polygon color (as integer value) from shadeset alc1.shd
    SHDFIL
    polygon fill pattern (as integer value) from shadeset geology2.shd
    NAME
    Geologic name of map unit (see list under LABL attribute)
    crs_geo.aat
    Geologic features such as contacts and faults that bound rock-unit polygons
    LTYPE
    Description of types of lines on the geologic map (contact, fault).
    ValueDefinition
    map boundary 
    contact, certain 
    fault, certain 
    fault, queried 
    fault, concealed 
    fault, approx. located 
    scratch boundary 
    Kvspi, porphyritic dike 
    L-SYMB
    stores appropriate line symbol value from the lineset geoscamp2.lin
    crs_str.pat
    Geological point data includes site-specific information describing the types and the orientation of bedding, foliation, and lineations. One annotation subclass is included in the geologic points coverage, CRS_STR which displays the respective dip and plunge values associated with individual point data.
    PTTYPE
    describes type of point data (bedding, horizontal bedding, foliation)
    ValueDefinition
    bedding 
    horizontal bedding 
    vertical bedding 
    overturned bedding 
    igneous joint 
    vertical igneous joint 
    igneous foliation 
    P-SYMB
    Coded integer value that relates point to cartographic point symbol in markerset geoscamp2.mrk
    STRIKE
    Azimuthal strike of planar feature
    DIP
    Dip of planar feature
    crs_ano.aat
    Annotation leaders
    L-SYMB
    Coded integer value (1) that relates arcs to cartographic line symbol in lineset geoscamp2.lin

Who produced the data set?

  1. Who are the originators of the data set? (may include formal authors, digital compilers, and editors)
    • C H. Gray, Jr.
    • Douglas M. Morton
    • F. Harold Weber, Jr.
  2. Who also contributed to the data set?
    Geologic mapping and digital preparation of this report were sponsored jointly by (1) the National Cooperative Geologic Mapping Program of the U.S. Geological Survey, (2) the California Division of Mines and Geology, and (3) the Southern California Areal Mapping Project (SCAMP).
  3. To whom should users address questions about the data?
    Douglas M. Morton
    U.S. Geological Survey, Western Region, Earth Surface Processes Team
    Project geologist
    U.S. Geological Survey
    Department of Earth Sciences
    University of California, Riverside
    Riverside, California
    United States of America

    (909) 276-6397 (voice)
    (909) 276-6295 (FAX)
    scamp@usgs.gov

Why was the data set created?

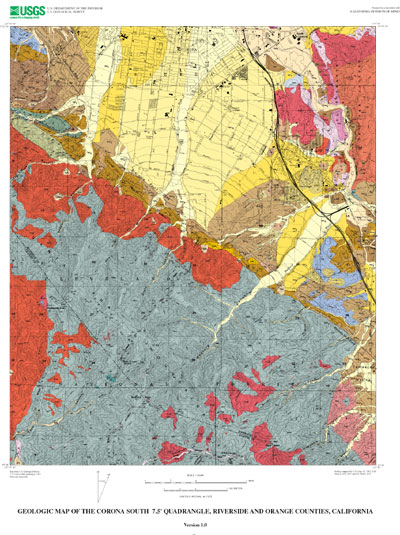
The data set for the Corona South 7.5' quadrangle was prepared under the U.S. Geological Survey Southern California Areal Mapping Project (SCAMP) as part of an ongoing effort to develop a regional geologic framework of southern California, and to utilize a Geographic Information System (GIS) format to create regional digital geologic databases. These regional databases are being developed as contributions to the National Geologic Map Database of the National Cooperative Geologic Mapping Program of the USGS.

How was the data set created?

  1. From what previous works were the data drawn?
  2. How were the data generated, processed, and modified?
    Date: 1950 (process 1 of 7)
    Field mapping and aerial photograph interpretation; iterative process (C.H. Gray).
    Date: 1973 (process 2 of 7)
    Field mapping and aerial photograph interpretation; iterative process (F.H. Weber).
    Date: 1977 (process 3 of 7)
    Field mapping and aerial photograph interpretation; iterative process (D.M. Morton).
    Date: 1999 (process 4 of 7)
    Digitization of geologic linework and point data from a scale-stable cartographic base of quadrangle. ARC/INFO database established; cleanup of artifacts; polygon, arc, and point attribute tables established. Digitizing and editing artifacts significant enough to display at a scale of 1:24,000 were corrected (K.R. Bovard and T. O'Brien).
    Date: 2001 (process 5 of 7)
    Description of map units and correlation of map units (F.K. Miller).
    Date: 26-Nov-2001 (process 6 of 7)
    First draft of metadata created by mwatson using FGDCMETA.AML ver. 1.2 05/14/98 on ARC/INFO data set /scamp26/mwatson/crs/crs_geo
    Date: 26-Nov-2001 (process 7 of 7)
    Creation of original metadata record Person who carried out this activity:
    U.S. Geological Survey
    Attn: Rachel M. Hauser
    Geologist
    U.S. Geological Survey
    Department of Earth Sciences
    University of California, Riverside
    Riverside, California
    USA

    (909) 276-6397 (voice)
    (909) 276-6295 (FAX)
    rhauser@usgs.gov
  3. What similar or related data should the user be aware of?
    Morton, D.M., 1999, Preliminary digital geologic map of the Santa Ana 30'x60' quadrangle, southern California, version 1.0.: U.S. Geological Survey Open-File Report 99-172, U.S. Geological Survey, California.

    Online Links:


How reliable are the data; what problems remain in the data set?

  1. How well have the observations been checked?
    Geologic-map units in the Corona South quadrangle database were described using standard field methods. Consistent with these methods, the database author has assigned standard geologic attributes to geologic lines, points, and polygons identified in the database.
    Nation-wide geologic-map accuracy standards have not been developed and adopted by the U.S. Geological Survey and other earth-science entities. Until such standards are adopted, the SCAMP project has developed internal map-accuracy standards for 1:24,000-scale geologic maps produced by the project.
    Geologic lines and points on 1:24,000 scale geologic maps are judged to meet SCAMP's internal map-accuracy standards if they are located to within +/-15 meters, relative to topographic or cultural features on the base map.
    On any derivative geologic-map plot, line data that are judged to meet the SCAMP internal map-accuracy standard are denoted by solid lines; line data that may not meet the SCAMP internal map-accuracy standard are denoted by dashed or dotted lines. There is no cartographic device for denoting the map-accuracy for geologic-point data (e.g., symbols representing bedding, foliation, lineations, etc.).
  2. How accurate are the geographic locations?
    The maximum transformation RMS error acceptable for a 7.5' quadrangle transformation and data input is 0.003 (1.8 meters). Horizontal positional accuracy was checked by visual comparison of hard-copy plots with base-stable source data.
  3. How accurate are the heights or depths?
  4. Where are the gaps in the data? What is missing?
    The geologic map database of the Corona South 7.5' quadrangle contains new data that have been subjected to rigorous review and are a substantially complete representation of the current state of knowledge concerning the geology of the quadrangle.
  5. How consistent are the relationships among the observations, including topology?
    Polygon and chain-node topology present. The areal extent of the map is represented digitally by an appropriately projected (polyconic projection), mathematically generated box. Consequently, polygons intersecting the lines that comprise the map boundary are closed by that boundary. Polygons internal to the map boundary are completely enclosed by line segments which are themselves a set of sequentially numbered coordinate pairs. Point data are represented by coordinate pairs.

How can someone get a copy of the data set?

Are there legal restrictions on access or use of the data?
Access_Constraints: none
Use_Constraints:
The Corona South 7.5' geologic-map database should be used to evaluate and understand the geologic character of the Corona South 7.5' quadrangle as a whole. The data should not be used for purposes of site-specific land-use planning or site-specific geologic evaluations. The database is sufficiently detailed to identify and characterize many actual and potential geologic hazards represented by faults and landslides and posed by ground subsidence and earthquake-generated ground shaking. However, it is not sufficiently detailed for site-specific determinations or evaluations of these features. Faults shown do not take the place of fault-rupture hazard zones designated by the California State Geologist (see Hart, 1988).
Use of this digital geologic-map database should not violate the spatial resolution of the data. Although the digital form of the data removes the constraint imposed by the scale of a paper map, the detail and accuracy inherent in map scale are also present in the digital data. The fact that this database was compiled and edited at a scale of 1:24,000 means that higher resolution information may not have been uniformly retained in the dataset. Plotting at scales larger than 1:24,000 will not yield greater real detail, although it may reveal fine-scale irregularities below the intended resolution of the database. Similarly, although higher resolution data is incorporated in most of the map, the resolution of the combined output will be limited by the lower resolution data.
  1. Who distributes the data set? (Distributor 1 of 1)
    USGS Information Services
    Box 25286 Denver Federal Center
    Denver, CO
    USA

    1-888-ASK-USGS (voice)
    303-202-4693 (FAX)
    ask@usgs.gov
  2. What's the catalog number I need to order this data set? USGS Open-File Report 02-21
  3. What legal disclaimers am I supposed to read?
    The U.S. Geological Survey (USGS) provides these geographic data "as is." The USGS makes no guarantee or warranty concerning the accuracy of information contained in the geographic data. The USGS further makes no warranties, either expressed or implied as to any other matter whatsoever, including, without limitation, the condition of the product, or its fitness for use lies entirely with the user. Although these data have been processed successfully on computers at the USGS, no warranty, expressed or implied, is made by the USGS regarding the use of these data on any other system, nor does the fact of distribution constitute or imply any such warranty.
    In no event shall the USGS have any liability whatsoever for payment of any consequential, incidental, indirect, special, or tort damages of any kind, including, but not limited to, any loss of profits arising out of use of or reliance on the geographic data or arising out of the delivery, installation, operation, or support by USGS.
    This digital geologic map database of the Corona South 7.5' quadrangle, 1:24,000 map-scale, and any derivative maps thereof, is not meant to be used or displayed at any scale larger than 1:24,000 (e.g., 1:12,000).
  4. How can I download or order the data?
    • Availability in digital form:
      Data format: Geologic units and structural features, with TIFF image of the base map in format ARCE (version 7.2.1) Size: 2.2
      Network links: http://pubs.usgs.gov/of/2002/0021/crs.tar.gz
    • Cost to order the data: none


Who wrote the metadata?

Dates:
Last modified: 10-Jun-2016
Metadata author:
Peter N Schweitzer
USGS Midwest Area
Collection manager, USGS Geoscience Data Clearinghouse, http://geo-nsdi.er.usgs.gov/
Mail Stop 954
12201 Sunrise Valley Dr
Reston, VA
USA

703-648-6533 (voice)
703-648-6252 (FAX)
pschweitzer@usgs.gov
Metadata standard:
Content Standard for Digital Geospatial Metadata (FGDC-STD-001-1998)

This page is <https://geo-nsdi.er.usgs.gov/metadata/open-file/02-21/metadata.faq.html>
Generated by mp version 2.9.48 on Tue Jul 03 20:06:06 2018