Online Links:
| Value | Definition |
|---|---|
| 1 | Fault; certain location |
| 2 | Fault; possible location |
| 3 | Fault; approximate location |
| 4 | Fault; concealed |
| 5 | Fault; probable location |
| 7 | Lineation |
| 8 | Anticline |
| Range of values | |
|---|---|
| Minimum: | 1 |
| Maximum: | 2 |
| Range of values | |
|---|---|
| Minimum: | 0 |
| Maximum: | 1 |
| Value | Definition |
|---|---|
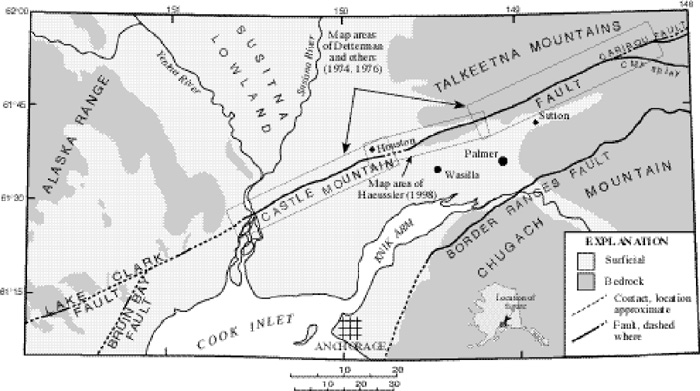
| CM001 | Haeussler, 1998 |
| CM002 | Detterman and others, 1974 |
| CM003 | Detterman and others, 1976 |
| CM004 | Saltus et al., 2001 |
| Range of values | |
|---|---|
| Minimum: | 0.0 |
| Maximum: | 7.6 |
| Range of values | |
|---|---|
| Minimum: | 0.3 |
| Maximum: | 9.1 |
GIS support by Keith A. Labay Raytheon ITSS contractor.
Provide land managers with an authoritative source for the location of the fault in the Talkeetna Mountains and Susitna Lowland. Digital maps may be displayed at any scale or projection, however the geologic data in this coverage is not intended for use at a scale larger than 1:63,360.
Are there legal restrictions on access or use of the data?Access_Constraints: None
Use_Constraints:Acknowledgement of the U.S. Geological Survey would be appreciated in products derived from this data.
Although this data has been used by the USGS, no warranty, expressed or implied, is made by the USGS as to the accuracy of the data and related materials. The act of distribution shall not constitute any such warranty, and no responsibility is assumed by the USGS in the use of these data, software, or related materials.
| Data format: | Geologic units, faults, and other structural features in format ARCE (version 7.2.1) Size: 0.5 |
|---|---|
| Network links: |
http://pubs.usgs.gov/of/2001/of01-504/cmfault.e00 http://pubs.usgs.gov/of/2001/of01-504/cmfault_pnt.e00 http://pubs.usgs.gov/of/2001/of01-504/cmfault_e.e00 http://pubs.usgs.gov/of/2001/of01-504/cmfault_c.e00 http://pubs.usgs.gov/of/2001/of01-504/cmfault_w.e00 http://pubs.usgs.gov/of/2001/of01-504/cmfaultw_pnt.e00 |