Processed Thematic Mapper satellite imagery for selected areas within the U.S.-Mexico borderlands

Metadata also available as - [Outline] - [Parseable text] - [XML]

Frequently anticipated questions:


What does this data set describe?

Title:
Processed Thematic Mapper satellite imagery for selected areas within the U.S.-Mexico borderlands
Abstract:
The passage of the North American Trade Agreement (NAFTA), establishment of the Border Environmental Cooperation Commission as well as the EPA U.S./Mexico Border XXI Program has focused attention to the environmental social-cultural, and economic conditions in the United States-Mexico frontier and to the enhanced necessity of a binational, transborder approach in addressing problems. Towards this end, this U.S.-Mexico borderlands Thematic Mapper selection is designed to be utilized as fundamental part of a basic geographic information system database for natural resource, environmental, and land-management studies.
  1. How might this data set be cited?
    Dohrenwend, John C., Gray, Floyd, and Miller, Robert J., 2000, Processed Thematic Mapper satellite imagery for selected areas within the U.S.-Mexico borderlands: U.S. Geological Survey Open-File Report 00-309, U.S. Geological Survey, Menlo Park, CA.

    Online Links:

  2. What geographic area does the data set cover?
    West_Bounding_Coordinate: -118.00
    East_Bounding_Coordinate: -97.00
    North_Bounding_Coordinate: 34.00
    South_Bounding_Coordinate: 27.00
  3. What does it look like?
    http://pubs.usgs.gov/of/2000/of00-309/screenshot.jpg (JPEG)
    Sample of one of the satellite images
    http://pubs.usgs.gov/of/2000/of00-309/FIGURES/TM_index.jpg (JPEG)
    Approximate locations of the centers of the TM scenes. Scenes indicated with a red circle are included in this dataset. Half filled circles indicate scenes shifted from the normal scene center.
  4. Does the data set describe conditions during a particular time period?
    Beginning_Date: 1984
    Ending_Date: 1997
    Currentness_Reference:
    ground condition
  5. What is the general form of this data set?
    Geospatial_Data_Presentation_Form: remote-sensing image
  6. How does the data set represent geographic features?
    1. How are geographic features stored in the data set?
      Indirect_Spatial_Reference:
      A Landsat 4 and 5 TM scene has an instantaneous field of view (IFOV) of 30 square meters in bands 1 through 5 and band 7, band 6 has an IFOV of 120 square meters on the ground. The resolution for the TM sensor is shown below: Landsats 4-5 Resolution (meters) Band 1 30 Band 2 30 Band 3 30 Band 4 30 Band 5 30 Band 6 120 Band 7 30
      This is a Raster data set. It contains the following raster data types:
      • Dimensions, type Pixel
    2. What coordinate system is used to represent geographic features?
  7. How does the data set describe geographic features?
    Entity_and_Attribute_Overview:
    These processed Landsat satellite images provide high-resolution multispectral coverage of selected areas. The characteristics of the MSS and TM bands were selected to maximize their capabilities for detecting and monitoring different types of Earth resources. For example, TM band 2 can detect green reflectance from healthy vegetation, and band 3 of TM is designed for detecting chlorophyll absorption in vegetation. TM band 4 is ideal for near-IR reflectance peaks in healthy green vegetation and for detecting water- land interfaces. Wavelength of TM band 1 can penetrate water for bathymetric mapping along coastal areas and is useful for soil-vegetation differentiation and for distinguishing forest types. The two mid-IR red bands on TM (bands 5 and 7) are useful for vegetation and soil moisture studies, and discriminating between rock and mineral types. The thermal-IR band on TM (band 6) is designed to assist in thermal mapping, and for soil moisture and vegetation studies. TM Bands 7, 4, and 2 have been combined to make false-color composite images. This band combination makes vegetation appear as shades of red, brighter reds indicating more vigorously growing vegetation. Soils with no or sparse vegetation will range from white (sands) to greens or browns depending on moisture and organic matter content. Water bodies will appear blue. Deep, clear water will be dark blue to black in color, while sediment- laden or shallow waters will appear lighter in color. Urban areas will appear blue-gray in color. Clouds and snow will be bright white. They are usually distinguishable from each other by the shadows associated with the clouds. Exposed bedrock will appear in a wide range of colors depending on the composition and other factors.
    Entity_and_Attribute_Detail_Citation: http://pubs.usgs.gov/of/2000/of00-309/OF00-309.DOC

Who produced the data set?

  1. Who are the originators of the data set? (may include formal authors, digital compilers, and editors)
    • John C. Dohrenwend
    • Floyd Gray
    • Robert J. Miller
  2. Who also contributed to the data set?
  3. To whom should users address questions about the data?
    Floyd Gray
    U.S. Geological Survey, GEO-WRG-MRS
    E.N.R Building
    Tucson, AZ
    USA

    520-670-5582 (voice)
    520-670-5571 (FAX)
    fgray@usgs.gov

Why was the data set created?

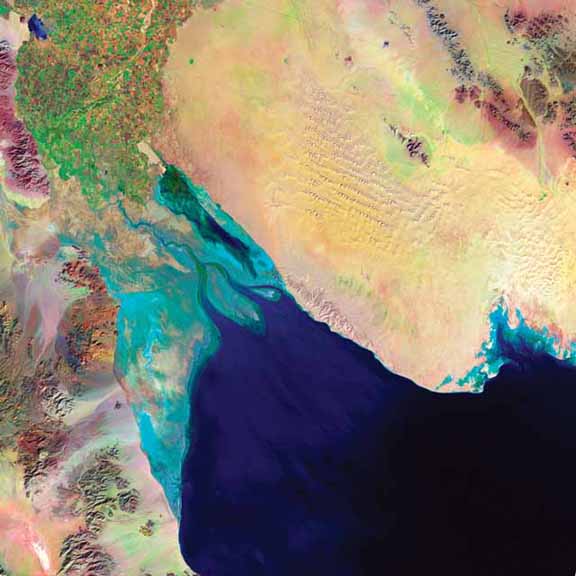
To provide processed satellite images of key areas along the U. S.-Mexico border for use in a broad spectrum of studies. Landsat data have been used by government, commercial, industrial, civilian, and educational communities in the U.S. and worldwide. They are being used to support a wide range of applications in such areas as global change research, agriculture, forestry, geology, resources management, geography, mapping, water quality, and oceanography. Landsat data have potential applications for monitoring the conditions of the Earth's land surface

How was the data set created?

  1. From what previous works were the data drawn?
    Landsat MSS (source 1 of 1)
    U.S. Geological Survey, 1972, Land Satellite Multispectral Scanner (Landsat MSS): U.S. Geological Survey, Sioux Falls, SD.

    Other_Citation_Details:
    The USGS entered into a partnership with NASA in the early 1970's to assume responsibility for the archive management and distribution of Landsat data products. On July 23, 1972, NASA launched the first in a series of satellites designed to provide repetitive global coverage of the Earth's land masses. Designated initially as the Earth Resources Technology Satellite-A (ERTS-A), it used a Nimbus-type platform that was modified to carry sensor systems and data relay equipment. When operational orbit was achieved, it was designated ERTS-1. The satellite continued to function beyond its designed life expectancy of 1 year and finally ceased to operate on January 6, 1978, more than 5 years after its launch date. The second in this series of Earth resources satellites (designated ERTS-B) was launched January 22, 1975. It was renamed Landsat 2 by NASA, which also renamed ERTS-1 to Landsat 1. Three additional Landsats were launched in 1978, 1982, and 1984 ( Landsats 3, 4, and 5 respectively). Each successive satellite system had improved sensor and communications capabilities.
    Type_of_Source_Media: cartridge tape
    Source_Contribution: Remote sensing imagery along with ancillary data.
  2. How were the data generated, processed, and modified?
    Date: 1999 (process 1 of 2)
    These images were processed on a Macintosh computer in Adobe Photoshop. Band selection and color balance were chosen to provide images useful for a broad spectrum of application. Data sources produced in this process:
    • Landsat MSS
    Date: 1999 (process 2 of 2)
    Creation of original metadata record Person who carried out this activity:
    Robert J Miller
    U.S. Geological Survey, GEO-WRG-MRS
    Mail Stop 901
    345 Middlefield Rd
    Menlo Park, CA
    USA

    650-329-5407 (voice)
    650-329-5490 (FAX)
    rjmiller@usgs.gov
  3. What similar or related data should the user be aware of?
    U.S. Geological Survey, 2000, Land Satellite (LANDSAT) Multispectral Scanner (MSS): U.S. Geological Survey, Sioux Falls, SD.

    Other_Citation_Details:
    The concept of a civilian Earth resources satellite was conceived in the Department of Interior in the mid-1960's. The National Aeronautics and Space Administration (NASA) embarked on an initiative to develop and launch the first Earth monitoring satellite to meet the needs of resource managers and Earth scientists. The USGS entered into a partnership with NASA in the early 1970's to assume responsibility for the archive management and distribution of Landsat data products. On July 23, 1972, NASA launched the first in a series of satellites designed to provide repetitive global coverage of the Earth's land masses.
    U.S. Geological Survey EROS Data Center, 1972, LGSOWG Landsat Multispectral Scanner (MSS) Imagery: U.S. Geological Survey, Sioux Falls SD.

    Other_Citation_Details:
    The Global Land Information System (GLIS) and the EOSDIS Information Management System (IMS) are interactive query systems providing information on this data set.

How reliable are the data; what problems remain in the data set?

  1. How well have the observations been checked?
    The identification of features is provided by the distinct electromagnetic energy it emits, reflects, or otherwise transmits. This is called the spectral signature. Other signatures are tone (lightness or darkness), texture (surface roughness or smoothness), pattern, shadow, shape and size are as important. Thus, through the use of Thematic Mapper, such elements as water features, soils, and vegetation can be identified and distinguished from each other. The wavelength range for the TM sensor is from the visible (blue), through the mid- IR, into the thermal-IR portion of the electromagnetic spectrum. Sixteen detectors for the visible and mid-IR wavelength bands in the TM sensor provide 16 scan lines on each active scan. Four detectors for the thermal-IR band provide four scan lines on each active scan. The TM sensor has a spatial resolution of 30 m for the visible, near-IR, and mid-IR wavelengths and a spatial resolution of 120 m for the thermal-IR band.
  2. How accurate are the geographic locations?
    The TM sensor has a spatial resolution of 30 meters for the visible, near-IR, and mid-IR wavelengths and a spatial resolution of 120 meters for the thermal-IR band.
  3. How accurate are the heights or depths?
  4. Where are the gaps in the data? What is missing?
    Images provided by this report cover selected areas of the U.S.- Mexico border zone.
  5. How consistent are the relationships among the observations, including topology?
    All of the Landsats have been in sun-synchronous orbits with equatorial crossing times ranging from 8:30 a.m. for Landsat 1, 9 a.m. for Landsat 2, to 9:45 a.m. for Landsat 5. The Landsat system provides for global data between 81 degrees north latitude and 81 degrees south latitude.

How can someone get a copy of the data set?

Are there legal restrictions on access or use of the data?
Access_Constraints: none
Use_Constraints: none
  1. Who distributes the data set? (Distributor 1 of 1)
    U.S. Geological Survey
    Customer Services Representative
    Open-File Reports, Box 252
    Denver, CO
    USA

    303-202-4200 (voice)
    303-202-4695 (FAX)
  2. What's the catalog number I need to order this data set? USGS Open-File Report 00-309
  3. What legal disclaimers am I supposed to read?
    Although these data have been processed successfully on a computer system at the U.S. Geological Survey, U.S. Department of the Interior, no warranty expressed or implied is made by the Geological Survey regarding the utility of the data on any other system, nor shall the act of distribution constitute any such warranty. The Geological Survey will warrant the delivery of this product in computer-readable format. and will offer appropriate adjustment of credit when the product is determined unreadable by correctly adjusted computer input peripherals, or when the physical medium is delivered in damaged condition. Requests for adjustments of credit must be made within 90 days from the date of this shipment from the ordering site.
  4. How can I download or order the data?

Who wrote the metadata?

Dates:
Last modified: 10-Jun-2016
Metadata author:
Peter N Schweitzer
USGS Midwest Area
Collection manager, USGS Geoscience Data Clearinghouse, http://geo-nsdi.er.usgs.gov/
Mail Stop 954
12201 Sunrise Valley Dr
Reston, VA
USA

703-648-6533 (voice)
703-648-6252 (FAX)
pschweitzer@usgs.gov
Metadata standard:
Content Standards for Digital Geospatial Metadata (FGDC-STD-001-1998)

This page is <https://geo-nsdi.er.usgs.gov/metadata/open-file/00-309/metadata.faq.html>
Generated by mp version 2.9.48 on Tue Jul 03 20:05:24 2018