Online Links:
| Value | Definition |
|---|---|
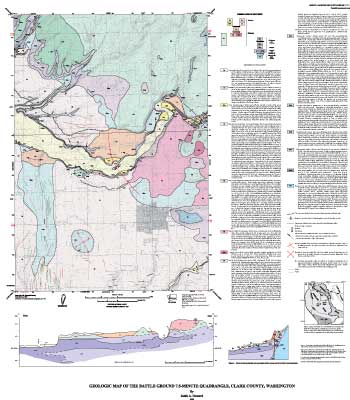
| Qa | Young alluvium (Holocene) |
| Ql | Landslides and basalt talus (Holocene) |
| Qoa | Older alluvium (upper Pleistocene?) |
| Qf | Fine-grained catastrophic flood deposits (upper Pleistocene) |
| Qt | Terrace deposits (upper Pleistocene) |
| Qb | Basalt of Battle Ground (upper Pleistocene) |
| Qbs | Basalt scoria |
| Qd | Glacial drift (Pleistocene) |
| QTta | Alluvial-fan member of Troutdale Formation (Pleistocene and/or Pliocene) |
| QTtv | Volcanic-clast member of the Troutdale Formation (Pleistocene or Pliocene) |
| QTtq | Quartzite-clast member of the Troutdale Formation (Pliocene) |
| QTtf | Fine-grained member of the Troutdale Formation (Pliocene and Miocene?) |
| QTtfs | Sand facies of the Troutdale Formation |
| Tsv | Skamania Volcanics |
| Value | Definition |
|---|---|
| dome, certain | long axis of dome structure, well established by observation and inference |
| f.a., syncline, concealed | synclinal fold axis, inferred |
| f.a., syncline, certain | synclinal fold axis, observed |
This database and accompanying plot files depict the distribution of geologic materials and structures at a regional (1:24,000) scale. The report is intended to provide geologic information for the regional study of materials properties, earthquake shaking, landslide potential, mineral hazards, seismic velocity, and earthquake faults. In addition, the report contains new information and interpretations about the regional geologic history and framework. However, the regional scale of this report does not provide sufficient detail for site development purposes.
Are there legal restrictions on access or use of the data?Access_Constraints: None
Use_Constraints:Uses of this digital geologic map should not violate the spatial resolution of the data. Although the digital form of the data removes the constraint imposed by the scale of a paper map, the detail and accuracy inherent in map scale are also present in the digital data. The fact that this database was edited for a scale of 1:24,000 means that higher resolution information is not present in the dataset. Plotting at scales larger than 1:24,000 will not yield greater real detail, although it may reveal fine-scale irregularities below the intended resolution of the database. Similarly, where this database is used in combination with other data of higher resolution, the resolution of the combined output will be limited by the lower resolution of these data.
Any use of trade, product, or firm names is for descriptive purposes only and does not imply endorsement by the U.S. Government. Although this publication has been subjected to rigorous review and is substantially complete, the USGS reserves the right to revise the data pursuant to further analysis and review. Furthermore, it is released on condition that neither the USGS nor the United States Government may be held liable for any damages resulting from its authorized or unauthorized use.
| Data format: | Geologic units and structural features in format ARCE (version 8.1) Size: 32 |
|---|---|
| Network links: |
http://pubs.usgs.gov/mf/2002/2395/2395db.tar.gz |