Geologic Map of the Death Valley Ground-Water Model Area, Nevada and California

Metadata also available as - [Outline] - [Parseable text] - [XML]

Frequently anticipated questions:


What does this data set describe?

Title:
Geologic Map of the Death Valley Ground-Water Model Area, Nevada and California
Abstract:
This digital geologic and tectonic database of the Death Valley ground-water model area, as well as its accompanying geophysical maps, are compiled at 1:250,000 scale. The map compilation presents new polygon, line, and point vector data for the Death Valley region. The map area is enclosed within a 3 degree X 3 degree area along the border of southern Nevada and southeastern California. In addition to the Death Valley National Park and Death Valley-Furnace Creek fault systems, the map area includes the Nevada Test Site, the southwest Nevada volcanic field, the southern end of the Walker Lane (from southern Esmeralda County, Nevada, to the Las Vegas Valley shear zone and Stateline fault system in Clark County, Nevada), the eastern California shear zone (in the Cottonwood and Panamint Mountains), the eastern end of the Garlock fault zone (Avawatz Mountains), and the southern basin and range (central Nye and western Lincoln Counties, Nevada). This geologic map improves on previous geologic mapping in the area by providing new and updated Quaternary and bedrock geology, new interpretation of mapped faults and regional structures, new geophysical interpretations of faults beneath the basins, and improved GIS coverages. The basic geologic database has tectonic interpretations imbedded within it through attributing of structure lines and unit polygons which emphasize significant and through-going structures and units. An emphasis has been put on features which have important impacts on ground-water flow. Concurrent publications to this one include a new isostatic gravity map (Ponce and others, 2001), a new aeromagnetic map (Ponce and Blakely, 2001), and contour map of depth to basement based on inversion of gravity data (Blakely and Ponce, 2001).
Supplemental_Information:
A composite base map is included which contains topographic contour lines based upon published USGS 1:100,000-scale DLG data and computer contouring (ARC/INFO) of published USGS 1-degree (3- by 3-arc-second spacing) DEM data and road lines and political boundaries both from published USGS 1:100,000-scale DLG data. 1:100,000-scale data was generalized to 1:250,000-scale for inclusion with the 1:250,000-scale database.
The subdirectory DVRFS_BASEMAPS within the database will contain additional coverages, grids, and projection files necessary for generating graphical representation of the map along with the basemap files. These include: the hypsography (dvrfs_hp), the political boundaries (dvrfs_bd), the roads (dvrfs_rd), the Nevada Test Site boundary (nts_bd), textpoint annotations for the base map (dvrfs_hptxt), the three color separated grids used to generate the hillshade on the tectonic map (dvrfs_blue, dvrfs_green, and dvrfs_red), a polygon coverage defining the map boundary (basemaparea) used for defining mapextent in ARCPLOT, a polygon coverage defining the map area (maparea), polygon coverage defining the groud-water model area (modelarea), a polygon coverage used to shade the tectonically significant structural zones (dvrfs_tzone), text labels for faults and regional structures (dvrfs_text), a coverage used to draw a map scale bar (scale250), and two projection files for the geographic projection (geo.prj) and UTM projection (utm.prj).
  1. How might this data set be cited?
    Workman, Jeremiah B., Menges, Christopher M., Page, William R., Taylor, Emily M., Ekren, E. B., Rowley, Peter D., Dixon, Gary L., Thompson, Ren A., and Wright, Laren A., 2002, Geologic Map of the Death Valley Ground-Water Model Area, Nevada and California: Miscellaneous Field Studies Map MF-2381-A, U. S. Geological Survey, Denver, Colorado.

    Online Links:

  2. What geographic area does the data set cover?
    West_Bounding_Coordinate: -118.000
    East_Bounding_Coordinate: -115.000
    North_Bounding_Coordinate: 38.250
    South_Bounding_Coordinate: 35.000
  3. What does it look like?
    http://geo-nsdi.er.usgs.gov/metadata/map-mf/2381/mf-2381.png (PNG)
    Reduced-size image of the study area showing the areas of previous mapping, 570x740 pixels, 248k bytes.
    http://pubs.usgs.gov/mf/2002/mf-2381/mf-2381-a/mf-2381-a.pdf (PDF)
    Printable representation of map sheet, 41 MB.
  4. Does the data set describe conditions during a particular time period?
    Calendar_Date: 2002
    Currentness_Reference:
    publication date
  5. What is the general form of this data set?
    Geospatial_Data_Presentation_Form: map
  6. How does the data set represent geographic features?
    1. How are geographic features stored in the data set?
      This is a vector data set.
    2. What coordinate system is used to represent geographic features?
      Grid_Coordinate_System_Name: Universal Transverse Mercator
      Universal_Transverse_Mercator:
      UTM_Zone_Number: 11
      Transverse_Mercator:
      Scale_Factor_at_Central_Meridian: 0.9996
      Longitude_of_Central_Meridian: -117.0
      Latitude_of_Projection_Origin: 0.0
      False_Easting: 500000.0
      False_Northing: 0.0
      Planar coordinates are encoded using coordinate pair
      Abscissae (x-coordinates) are specified to the nearest 65
      Ordinates (y-coordinates) are specified to the nearest 65
      Planar coordinates are specified in meters
      The horizontal datum used is North American Datum of 1927.
      The ellipsoid used is Clarke 1866.
      The semi-major axis of the ellipsoid used is 6378206.4.
      The flattening of the ellipsoid used is 1/294.98.
  7. How does the data set describe geographic features?
    Entity_and_Attribute_Overview:
    The database consists of eight coverages (excluding the coverages mentioned in the Supplemental_Information element)
    The individual attributes for each coverage are described as follows (*=DVRFS):
    --------POLYGONS-<*_GEO>
    UNIT: see map text for explanation of lithologic unit symbols
    &=Pennsylvanian
    @=Triassic
    _=Cambrian
    UNIT_CODE:
    1=surficial Quaternary unit
    2=igneous Quaternary unit
    3=sedimentary Tertiary unit
    4=volcanic Tertiary unit
    5=intrusive Tertiary unit
    6=sedimentary Mesozoic unit
    7=igneous Mesozoic unit
    8=sedimentary Paleozoic unit
    9=igneous Paleozoic unit
    10=Precambrian unit
    TECT_CODE:
    0=no tectonic significance assigned
    1=Mesozoic intrusive rocks
    2=Tertiary intrusive rocks
    3=Proterozoic basement rocks (base of ground-water model)
    SYMBOL: value from CTR269 shadeset for coloring polygons
    --------ARCS-<*_GEO, *_FLT, *_GPFLT, *_CALD, *_LIN, *_TLINE, *_WLANE>
    TECT_INDEX (*_FLT only):
    0=not regionally significant structure
    1=regionally significant structure
    LABEL (*_CALD, *_LIN, *_TLINE, and *_WLANE only):
    character attribute describing structure
    LINE_CODE, DESCRIPTION (*_GEO, *_FLT, *_GPFLT and *_CALD only):
    1, "contact-certain"
    2, "contact-inferred"
    10, "contact-faulted" +
    20, "fault-certain"
    21, "fault-inferred"
    22, "fault-concealed"
    23, "fault-queried"
    30, "thrust fault-certain"
    31, "thrust fault-inferred"
    32, "thrust fault-concealed"
    40, "low-angle normal fault-certain"
    41, "low-angle normal fault-inferred"
    42, "low-angle normal fault-concealed"
    60, "caldera boundary-certain"
    62, "caldera boundary-concealed"
    90, "geophysically inferred structure-well constrained"
    91, "geophysically inferred structure-poorly constrained"
    99, "map area boundary"
    + code=10 is used for lines which represent both fault lines and unit contacts in DVRFS_GEO.  It is a cartographic designation for lines repeated in both the geology and fault coverages so that they will not be drawn twice in plotting and is not used uniformly due to inconsistent attribution of source data.
    SYMBOL: value from GEOSCAMP1 lineset for drawing lines
    --------ARC-<*_SYM>
    SYMBOL:
    1= bar and ball symbol
    2= bar and ball symbol (geophysically inferred structure)
    3= right-lateral offset arrows
    4= right-lateral offset arrows (geophysically inferred structure)
    5= left-lateral offset arrows
    6= left-lateral offset arrows (geophysically inferred structure)
    --------POINT-<*_SYM>
    SYMBOL:
    1= bar and ball symbol
    2= bar and ball symbol (geophysically inferred structure)
    3= right-lateral offset arrows
    4= right-lateral offset arrows (geophysically inferred structure)
    5= left-lateral offset arrows
    6= left-lateral offset arrows (geophysically inferred structure)
    ANGLE: angle to plot offset symbol
    
    Entity_and_Attribute_Detail_Citation: http://pubs.usgs.gov/mf/2002/mf-2381/mf-2381-a/mf-2381-a_p.pdf

Who produced the data set?

  1. Who are the originators of the data set? (may include formal authors, digital compilers, and editors)
    • Jeremiah B. Workman
    • Christopher M. Menges
    • William R. Page
    • Emily M. Taylor
    • E. B. Ekren
    • Peter D. Rowley
    • Gary L. Dixon
    • Ren A. Thompson
    • Laren A. Wright
  2. Who also contributed to the data set?
  3. To whom should users address questions about the data?
    Jeremiah B. Workman
    U. S. Geological Survey
    Box 25046
    Denver, CO
    U.S.A.

    303-236-1257 (voice)
    jworkman@usgs.gov

Why was the data set created?

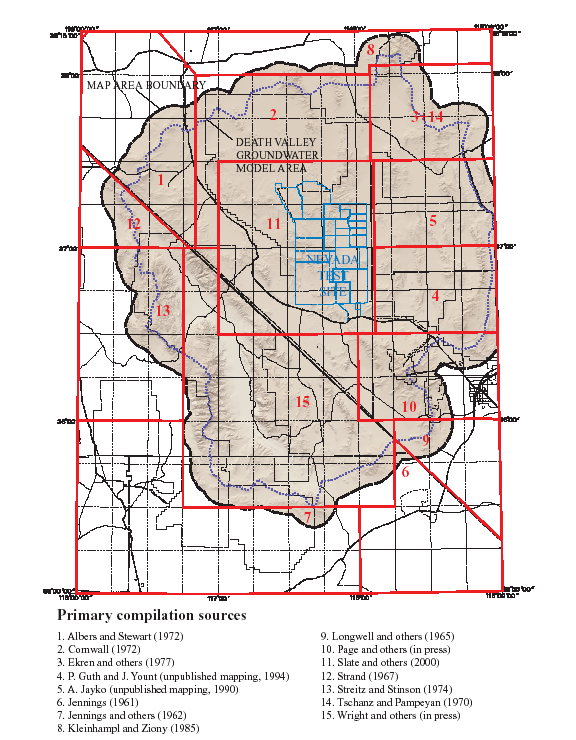
This map compilation was completed in support of the Death Valley Ground-Water Basin regional flow model funded by the Department of Energy in conjunction with the U. S. Geological Survey and National Park Service. The proposed model is intended to address issues concerning the availability of water in Death Valley National Park and surrounding counties of Nevada and California and the migration of contaminants off of the Nevada Test Site and Yucca Mountain high-level waste repository. The geologic compilation and tectonic interpretations contained within this database will serve as the basic framework for the flow model. The database also represents a synthesis of many sources of data compiled over many years in this geologically and tectonically significant area.

How was the data set created?

  1. From what previous works were the data drawn?
  2. How were the data generated, processed, and modified?
    Date: 1999 (process 1 of 8)
    Compilation of previous digital data.
    Date: 1999 (process 2 of 8)
    Reinterpretation, editing, edgmatching, and updating of previous mapping.
    Date: 1999 (process 3 of 8)
    Digitized and incorporated new mapping into database.
    Date: 2000 (process 4 of 8)
    Review of data by J. Stewart and P. Stone (concentrating on bedrock and older structures).
    Date: 2001 (process 5 of 8)
    Review of data by M. Reheis (concentrated on quaternary deposits and structure).
    Date: 2001 (process 6 of 8)
    Review of data by R. Bohannon (concentrated on Tertiary sediments and volcanics)
    Date: 2000 (process 7 of 8)
    final editing of database to address review comments
    Date: 02-Jul-2002 (process 8 of 8)
    Creation of original metadata record Person who carried out this activity:
    Jeremiah B. Workman
    U. S. Geological Survey
    Box 25046
    Denver, CO
    USA

    303-236-1257 (voice)
    jworkman@usgs.gov
  3. What similar or related data should the user be aware of?

How reliable are the data; what problems remain in the data set?

  1. How well have the observations been checked?
    The database was compiled largely from pre-existing digital data and combined in ARC/INFO. Frequency tests were run on the arc and polygon labels to ensure that no features are unlabeled. The attributes have been checked by both the authors and the reviewers for agreement with published maps, unpublished field mapping, annotated airphotos, annotated LANSAT images, and preliminary drafted versions of the map. The attribute data in the data set should be taken as an accurate representation of the authors' geologic interpretations.
  2. How accurate are the geographic locations?
    The estimated horizontal positional accuracy of the data is 65 meters. All data used from published and unpublished digital sources is limited by the accuracy of that data. Attempts were made to verify the accuracy of this data by comparison to published topographic data and overlap with other digital data. All new linework and point data were digitized at 1:100,000 and 1:250,000 scale using a CalComp digitizing tablet (model 34360) with an accuracy of 0.005 inches (~12 meters at 1:100,000 scale and ~30 meters at 1:250,000 scale) or by on screen digitizing from georeferenced digital imagery at an approximate 1:100,000 scale. This database was produced to be used at 1:250,000 scale and any problems arising from use at other scales are not the responsibilities of the authors. No vertical data are included in the database (basemap elevations are reproductions of published USGS topographic maps).
  3. How accurate are the heights or depths?
  4. Where are the gaps in the data? What is missing?
    This dataset includes only the coverages pertaining to the geologic map. Any margin material on the printed map (correlation chart, explanation of map symbols) is not included. This map was produced to be used at 1:250,000 scale. Any geologic features too small to be shown at this scale have been omitted or generalized if they are of significant importance. The smallest objects are approximately 100 meters on a side. A topographic base map compiled from the published USGS DLG and DEM data is included.
  5. How consistent are the relationships among the observations, including topology?
    The database was compiled from data mapped previously at various scales from 1:24,000 scale to 1:250,000 scale. The data was generalized to fit a consistent set of criteria. All lines were visually inspected by the authors for proper intersections, repetition, overshoots, undershoots, and overall logical consistency. The geologic features in the map area are all described, in the view of the authors, at a consistent scale of 1:250,000. All coverages were cleaned and built in ARC/INFO (version 8.2) to ensure a logical consistency which is topologically clean.

How can someone get a copy of the data set?

Are there legal restrictions on access or use of the data?
Access_Constraints: None
Use_Constraints: None
  1. Who distributes the data set? (Distributor 1 of 1)
    U.S. Geological Survey Central Publications Group
    Denver, CO

    303-236-5486 (voice)
  2. What's the catalog number I need to order this data set?
  3. What legal disclaimers am I supposed to read?
    Although this digital spatial data has been subjected to rigorous review and is substantially complete, it is released on the condition that neither the USGS nor the United States Government may be held liable for any damage resulting from its authorized or unauthorized use.
  4. How can I download or order the data?

Who wrote the metadata?

Dates:
Last modified: 05-Feb-2016
Metadata author:
Peter N Schweitzer
USGS Midwest Area
Collection manager, USGS Geoscience Data Clearinghouse, http://geo-nsdi.er.usgs.gov/
Mail Stop 954
12201 Sunrise Valley Dr
Reston, VA
USA

703-648-6533 (voice)
703-648-6252 (FAX)
pschweitzer@usgs.gov
Metadata standard:
Content Standard for Digital Geospatial Metadata (FGDC-STD-001-1998)
Metadata extensions used:

This page is <https://geo-nsdi.er.usgs.gov/metadata/map-mf/2381/a/metadata.faq.html>
Generated by mp version 2.9.48 on Tue Jul 03 20:05:12 2018