Generalized Surficial Geologic Map of the Denver 1°x2° Quadrangle, Colorado

Metadata also available as - [Outline] - [Parseable text] - [XML]

Frequently anticipated questions:


What does this data set describe?

Title:
Generalized Surficial Geologic Map of the Denver 1°x2° Quadrangle, Colorado
Abstract:
Thirty-nine types of surficial geologic deposits and residual materials of Quaternary age are described and mapped in the greater Denver area, in part of the Front Range, and in the piedmont and plains east of Denver, Boulder, and Castle Rock. Descriptions appear in the pamphlet that accompanies the map. Landslide deposits, colluvium, residuum, alluvium, and other deposits or materials are described in terms of predominant grain size, mineral or rock composition (e.g., gypsiferous, calcareous, granitic, andesitic), thickness of deposits, and other physical characteristics. Origins and ages of the deposits and geologic hazards related to them are noted. Many lines between geologic units on our map were placed by generalizing contacts on published maps. However, in 1997-1999 we mapped new boundaries, as well. The map was projected to the UTM projection. This large map area extends from the Continental Divide near Winter Park and Fairplay ( on the west edge), eastward about 107 mi (172 km); and extends from Boulder on the north edge to Woodland Park at the south edge (68 mi; 109 km).
Supplemental_Information:
Compilation scale: 1:250,000. Map is available in digital and print-on-demand paper formats. Deposits are described in terms of predominant grain size, mineralogic and lithologic composition, general thickness, and geologic hazards, if any, relevant geologic historical information and paleosoil information, if any. Thirty- nine map units of deposits include 5 alluvium types, 15 colluvia, 6 residua, 3 types of eolian deposits, 2 periglacial/disintegrated deposits, 3 tills, 2 landslide units, 2 glaciofluvial units, and 1 diamicton. An additional map unit depicts large areas of mostly bare bedrock.
The physical properties of the surficial materials were compiled from published soil and geologic maps and reports, our field observations, and from earth science journal articles. Selected deposits in the field were checked for conformity to descriptions of map units by the Quaternary geologist who compiled the surficial geologic map units.
FILES INCLUDED IN THIS DATA SET:
denvpoly: polygon coverage containing geologic unit contacts and labels.
denvline: arc coverage containing faults.
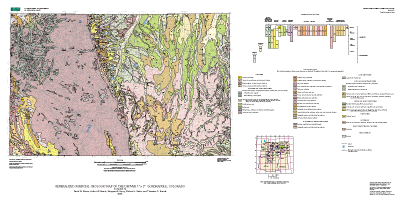
geol_sfo.lin:  This lineset file defines geologic line types in the
               geologically themed coverages.
geoscamp2.mrk:  This markerset file defines the geologic markers in the
                geologically themed coverages.
color524.shd:  This shadeset file defines the cmyk values of colors
               assigned to polygons in the geologically themed coverages.
  1. How might this data set be cited?
    Moore, David W., Straub, Arthur W., Berry, Margaret E., Baker, Michael L., and Brandt, Theodore R., 2001, Generalized Surficial Geologic Map of the Denver 1°x2° Quadrangle, Colorado: U.S. Geological Survey Miscellaneous Field Studies Map MF-2347, U.S. Geological Survey, Denver, Colorado.

    Online Links:

  2. What geographic area does the data set cover?
    West_Bounding_Coordinate: -106.0
    East_Bounding_Coordinate: -104.0
    North_Bounding_Coordinate: 40.0
    South_Bounding_Coordinate: 39.0
  3. What does it look like?
    http://pubs.usgs.gov/mf/2001/mf-2347/mf-2347.gif (GIF)
    Reduced image showing the entire map sheet. 400x203 pixels, 24-bit color.
    http://pubs.usgs.gov/mf/2001/mf-2347/mf-2347po.pdf (PDF)
    The browse graphic file depicts a layout, featuring geologic map and supporting information. The geologic map image is colored, labeled polygons of surficial geologic units and is shown with a scanned image of roads, rivers, political boundaries, place names, and other base map features, all registered to the geologic map. These features are the standard USGS 1:250,000 base map data, including longitude and latitude, numbered UTM (meters), and the Colorado State Coordinate System (feet) grid ticks (21 internal grid tics at 15-minute intervals of longitude and latitude are visible). Supporting information includes a correlation chart of geologic map units, a list of map unit symbols and names, and a small location map that shows the quadrangle location relative to rivers, state boundaries, and locations of 26 published USGS geologic maps (1:250,000 scale) in the Colorado Plateau and western Great Plains. This PDF file is optimized for highest print quality. An accompanying pamphlet includes a complete description of map units, selected references, and a description of terminology used.
  4. Does the data set describe conditions during a particular time period?
    Calendar_Date: 2001
    Currentness_Reference:
    publication date
  5. What is the general form of this data set?
  6. How does the data set represent geographic features?
    1. How are geographic features stored in the data set?
      This is a Vector data set.
    2. What coordinate system is used to represent geographic features?
      Grid_Coordinate_System_Name: Universal Transverse Mercator
      Universal_Transverse_Mercator:
      UTM_Zone_Number: 13
      Transverse_Mercator:
      Scale_Factor_at_Central_Meridian: .9996
      Longitude_of_Central_Meridian: -105.0
      Latitude_of_Projection_Origin: 0.0
      False_Easting: 500000
      False_Northing: 0.0
      Planar coordinates are encoded using coordinate pair
      Abscissae (x-coordinates) are specified to the nearest 200
      Ordinates (y-coordinates) are specified to the nearest 200
      Planar coordinates are specified in METERS
      The horizontal datum used is North American Datum of 1927.
      The ellipsoid used is Clarke 1866.
      The semi-major axis of the ellipsoid used is 6378206.4.
      The flattening of the ellipsoid used is 1/294.98.
  7. How does the data set describe geographic features?
    Entity_and_Attribute_Overview:

    DATABASE STRUCTURE -- ArcInfo and ArcView ==========
    There are two coverages (root name = denv) and three additional info files.
    This GIS database includes related look-up tables, which store detailed attribute information. Arc/Info relates for each coverage are saved in a file named <covername>.rel. Use the RELATE command with the restore argument at the arc prompt to make the relates active. Alternatively, in Arctools, use the Relate environment: open dialog in the Manage - Relates flyout menu under the Arctools menu to make the relates active.
    denvpoly coverage: contains all contact lines and labelpoints for each geologic polygon. In the denvpoly.pat INFO file the LABEL item indicates the rock unit label (abbreviation) used to label the unit on the map. The DESC item contains the formal or informal unit name. The SOURCE item contains the numeric code used to identify the data source for the rock unit. The SYMBOL item contains the shadeset symbol number used by ArcInfo to plot a filled/shaded polygon. The symbol numbers in this coverage refer to the color524.shd shadeset.
    In the coverage's denvpoly.aat INFO file the NAME item contains the name given to the structural feature. The SOURCE item contains the numeric code used to identify the data source for the structural feature. The SYMBOL item contains the lineset symbol number used by ArcInfo to plot a line. The symbol numbers in this coverage refer to the geol_sfo.lin lineset.
    In the the coverages's denvpoly.ref INFO file the SOURCE item lists the numeric code used to identify the data source. The scale item list the scale of the source map. (This value is the denominator of the proportional fraction that identifies the scale of the map that was digitized or scanned to produce the digital map.) The AUTHORS item lists the author(s) or compiler(s) of source map entered as last name, first name or initial, and middle initial. The YEAR item lists the source (map) publication date. The REFERENCE item lists the remainder of the reference in USGS reference format.
    The INFO structure of these files is listed below:
    DENVPOLY.PAT:
    
    COLUMN   ITEM NAME        WIDTH OUTPUT  TYPE N.DEC  ALTERNATE NAME
        1  AREA                   8    18     F      5
        9  PERIMETER              8    18     F      5
       17  DENVPOLY#              4     5     B      -
       21  DENVPOLY-ID            4     5     B      -
       25  SOURCE                 4     4     I      -
       29  LABEL                 10    10     C      -
       39  DESC                 123   123     C      -
      162  SYMBOL                 3     3     I      -
    DENVPOLY.AAT:
    
    COLUMN   ITEM NAME        WIDTH OUTPUT  TYPE  N.DEC  ALTERNATE NAME
        1  FNODE#                 4     5     B      -
        5  TNODE#                 4     5     B      -
        9  LPOLY#                 4     5     B      -
       13  RPOLY#                 4     5     B      -
       17  LENGTH                 8    18     F      5
       25  DENVPOLY#              4     5     B      -
       29  DENVPOLY-ID            4     5     B      -
       33  NAME                  30    30     C      -
       63  SOURCE                 4     4     I      -
       67  SYMBOL                 3     3     I      -
    DENVPOLY.REF:
    
    COLUMN   ITEM NAME        WIDTH OUTPUT  TYPE N.DEC  ALTERNATE NAME
        1  SOURCE                 4     4     I      -
        5  SCALE                  8     8     I      -
       13  AUTHORS              200   200     C      -
      213  YEAR                   4     4     I      -
      217  REFERENCE            250   250     C      -
    
      Unique values of NAME in DENVPOLY.AAT: contact, neat, water
    
    denvline coverage: contains faults. In the denvline.aat INFO file the NAME item indicates the name given to the structural feature.
    In the the coverages's denvline.ref INFO file the SOURCE item lists the numeric code used to identify the data source. The scale item list the scale of the source map. (This value is the denominator of the proportional fraction that identifies the scale of the map that was digitized or scanned to produce the digital map.) The AUTHORS item lists the author(s) or compiler(s) of source map entered as last name, first name or initial, and middle initial. The YEAR item lists the source (map) publication date. The REFERENCE item lists the remainder of the reference in USGS reference format.
    The INFO structure of these files is listed below:
    DENVLINE.AAT:
    
    COLUMN   ITEM NAME        WIDTH OUTPUT  TYPE N.DEC  ALTERNATE NAME
        1  FNODE#                 4     5     B      -
        5  TNODE#                 4     5     B      -
        9  LPOLY#                 4     5     B      -
       13  RPOLY#                 4     5     B      -
       17  LENGTH                 8    18     F      5
       25  DENVLINE#              4     5     B      -
       29  DENVLINE-ID            4     5     B      -
       33  NAME                  30    30     C      -
       63  SOURCE                 4     4     I      -
       67  SYMBOL                 3     3     I      -
    DENVLINE.REF:
    
    COLUMN   ITEM NAME        WIDTH OUTPUT  TYPE N.DEC  ALTERNATE NAME
        1  SOURCE                 4     4     I      -
        5  SCALE                  8     8     I      -
       13  AUTHORS              200   200     C      -
      213  YEAR                   4     4     I      -
      217  REFERENCE            250   250     C      -
    
      Unique values of NAME in DENVLINE.AAT: High-angle reverse fault
    Database root name: denv
    LABEL AND DESCRIPTION FOR GEOLOGIC UNITS MAPPED
    LABEL              DESC
    afa      Alluvial-fan deposit
    cac      Arkosic loamy colluvium and sheetwash alluvium
    cacb     Bouldery phase of arkosic loamy colluvium
    xch      Clayey, calcareous disintegration residuum
    dba      Crystalline-clast deposits
    dbd      Mixed-lithology-clast deposits
    asa      Alluvial sand, silt, clay, and gravel (post-Piney
             Creek alluvium, Piney Creek Alluvium,and pre-Piney Creek alluvium
    ed       Stabilized dune sand
    es       Eolian sand
    jea      Slump-block, earthflow, and mudflow landslide deposits
    ccd      Calcareous clayey colluvium
    ccm      Andesitic clayey colluvium
    caa      Andesitic loamy colluvium
    clx      Clay loam colluvium
    csk      Grus, crystalline-clast colluvium, rock outcrop, and alluvium
    csm      Tuffaceous colluvium
    cgc      Gneiss- and granite-clast gravelly colluvium
    cgh      Arkose-clast loamy colluvium
    cbh      Blocky sedimentary-rock colluvium
    cbm      Carbonate-clast loamy colluvium
    cbs      Rhyolite- and andesite-clast colluvium
    cbu      Mixed-lithology blocky colluvium
    xlu      Feldspathic loamy disintegration residuum
    xlv      Loamy disintegration residuum, eolian sand, and sheetwash alluvium
    xsa      Feldspathic quartz-sand disintegration residuum
    xgb      Latite-clast disintegration residuum
    jbc      Bouldery crystalline-rock landslide deposit
    xsg      Feldspathic quartz-sand disintegration residuum
    elb      Loess (Peoria Formation)
    tbg      Crystalline-clast bouldery till
    tbj      Mixed-lithology-clast bouldery till
    ggq      Outwash sand and gravel (outwash of Bull Lake, Pinedale, and post-Pinedale ages)
    ags      Alluvial sand, silt, clay and gravel (Louviers and Slocum
             Alluviums, undivided; late middle Pleistocene)
    tbk      Bouldery till (till of pre-Bull Lake glaciations)
    gge      Outwash sand and gravel (outwash of pre-Bull Lake glaciations)
    agm      Alluvium gravel and sand (Verdos and Rocky Flats Alluviums,
             undivided; early middle Pleistocene and early Pleistocene)
    pga      Pediment gravel
    cra      Hogback and rangefront colluvium, alluvium, and rock outcrop complex
    QTdd     Diamicton
    R        Bedrock
    w        Open water
    
    Entity_and_Attribute_Detail_Citation: http://pubs.usgs.gov/mf/2001/mf-2347/mf-2347pam.pdf

Who produced the data set?

  1. Who are the originators of the data set? (may include formal authors, digital compilers, and editors)
    • David W. Moore
    • Arthur W. Straub
    • Margaret E. Berry
    • Michael L. Baker
    • Theodore R. Brandt
  2. Who also contributed to the data set?
    In 1978, Lucille A. Piety hand drafted a map of surficial geologic units for the Denver quadrangle. She accomplished this by generalizing linework from the published Geologic Map of the Denver 1°x2° quadrangle, north-central Colorado (Bruce Bryant, L.W. McGrew, and R.A. Wobus, 1981, USGS Miscellaneous Investigations Series Map I- 1163). This linework was intended to be reduced as partial input for a more extensive 1:1,000,000-scale map. We digitized these lines initially, edited them to obtain more detail and accuracy, and added data appropriate for a 1:250,000-scale published map. Piety also classified the surficial units. However, because this system was designed for a 1:1,000,000-scale map (less detailed map), we had to make a more detailed classification to replace it.
  3. To whom should users address questions about the data?
    David W. Moore
    U.S. Geological Survey
    PO Box 25046, MS 913, Denver federal Center
    Denver, CO
    USA

    (303) 236-1271 (voice)
    dwmoore@usgs.gov

Why was the data set created?

The map and descriptions offer information that may be used for: land-use planning (e.g. selecting land fill sites, greenbelts, avoiding geologic hazards), for finding aggregate resources (crushed rock, sand, and gravel), for study of geomorphology and Quaternary geology. Geologic hazards (e.g., landslides, swelling soils, heaving bedrock, and flooding) known to be located in, or characteristic of some mapped units, were identified.
Surficial deposits in the quadrangle partially record depositional events of the Quaternary Period (the most recent 1.8 million years). Some events such as floods are familiar to persons living in the area, while other recorded events are pre-historical. The latter include glaciation, probable large earthquakes, protracted drought, and widespread deposition of sand and silt by wind. At least twice in the past 200,000 years (most recently about 30,000 to 12,000 years ago) global cooling caused glaciers to form along the Continental Divide. The glaciers advanced down valleys in the Front Range, deeply eroded the bedrock, and deposited moraines (map units tbg, tbj) and outwash (ggq, gge). On the plains (east part of map), eolian sand (es), stabilized dune sand (ed), and loess (elb) are present and in places contain buried paleosols. These deposits indicate that periods of sand dune deposition alternated with periods of stabilized dunes and soil formation.

How was the data set created?

  1. From what previous works were the data drawn?
    I-1163 (source 1 of 1)
    Bryant, Bruce, McGrew, L.W., and Wobus, R.A., 1981, Geologic Map of the Denver 1°x2° quadrangle, north-central Colorado: U.S. Geological Survey Miscellaneous Investigations Series Map I-1163.

    Type_of_Source_Media: paper
    Source_Scale_Denominator: 250000
    Source_Contribution: Initial linework and classificaton
  2. How were the data generated, processed, and modified?
    Date: 1978 (process 1 of 9)
    In 1978, Lucille A. Piety hand drafted a map of surficial geologic units for the Denver quadrangle. She accomplished this by generalizing linework from the published Geologic Map of the Denver 1°x2° quadrangle, north-central Colorado (Bruce Bryant, L. W. McGrew, and R.A. Wobus, 1981, USGS Miscellaneous Investigations Series Map I-1163). This linework was intended to be reduced as partial input for a more extensive 1:1,000,000- scale map. We digitized these lines initially, edited them to obtain more detail and accuracy, and added data appropriate for a 1:250,000-scale published map. Piety also classified the surficial units. However, because this system was designed for a 1:1,000,000-scale map (less detailed map), we had to make a more detailed classification to replace it. Data sources used in this process:
    • I-1163
    Date: 1999 (process 2 of 9)
    The Denver surficial geologic database was digitized from pen- and-ink compilations on scale-stable base material using the GSMCAD public domain program (USGS Open-File Report 96-007).
    Date: 1999 (process 3 of 9)
    The digitized linework was edited and revised several times for improved accuracy.
    Date: 1999 (process 4 of 9)
    The database was exported to ArcInfo using the GSMCAD export function to create ARC-generated ASCII files and the gsmarc.aml program in ARC to convert the ASCII files to ARC coverages and build polygons.
    Date: 2000 (process 5 of 9)
    Coverages were edited and revised in ArcInfo 7.2.1 to reflect editorial changes and to further attribute polygons with descriptions and all features with source information.
    Date: 2000 (process 6 of 9)
    External attribute lookup tables for labels and symbols were incorporated into the coverages using the joinitem command.
    Date: 2000 (process 7 of 9)
    Final revisions to the digital database were made and a map layout (browse graphic) prepared in Adobe Illustrator.
    Date: 2001 (process 8 of 9)
    The digital database was quality checked by the data manager, USGS Central Region Earth Surface Processes team.
    Date: 27-Jul-2009 (process 9 of 9)
    Creation of original metadata record Person who carried out this activity:
    U.S. Geological Survey
    Attn: David W. Moore
    U.S. Geological Survey
    Lakewood, CO

    (303) 236-1271; (303) 236-1232 (voice)
  3. What similar or related data should the user be aware of?

How reliable are the data; what problems remain in the data set?

  1. How well have the observations been checked?
    We checked attributes for accuracy by preparing a check plot in which map element colors, patterns, and decorations are determined by the attribute values. The plot was then visually checked against the geologists' original compilations. Polygon closure, compilation, and attribution errors were corrected.
  2. How accurate are the geographic locations?
    Map lines that depict contacts between geologic units were placed by generalizing contacts obtained from published geologic maps, viewing orthophotoquads in USDA county published soil reports, and the authors' field observations. Lines were digitized by using a digitizer tablet having a resolution of 0.001 in. No elevation data exist in the database. No systematic analysis of accuracy was attempted. The best accuracy is that of map lines around boundaries of young channel alluvial deposits, unit asa. They are within 2 mm of their correct map location (within 500 m of actual ground limits) relative to map symbols that depict topography and streams. Perhaps half are within 1 mm of correct map location (250 m of actual ground location). Other map boundaries that represent colluvial, residual, and eolian deposits are less accurately placed because ground limits of these deposits are indefinite, i.e., they grade into one another. Thus, many boundaries on the map (vectorized polygons) are approximate. Another source of inaccuracy is that a material may contain inclusions of surficial materials other than the material depicted by any given map unit.
  3. How accurate are the heights or depths?
  4. Where are the gaps in the data? What is missing?
    Data are complete: no features that could be accurately represented at the compilation scale of 1:250,000 were eliminated. Map units have been generalized from larger or same-scale source maps. Unit properties are described in the accompanying pamphlet. The smallest area expressed in this data set is approximately 62,500 square meters (0.0625 sq. km. or, a square area 250 m on a side).
  5. How consistent are the relationships among the observations, including topology?
    Map elements were visually checked for overshoots, undershoots, duplicate features, polygon closures, and other errors. Automated ( ArcInfo AML) routines were also used to check the databases for polygon label errors, line or point attribution errors, sliver polygons, dangling arcs, intersection errors, and projection information. The map was reviewed by two geologists, including another Quaternary specialist for consistency with geologic principles and general conformity to USGS mapping standards.

How can someone get a copy of the data set?

Are there legal restrictions on access or use of the data?
Access_Constraints: none
Use_Constraints:
none. Acknowledgment of the U.S. Geological Survey would be appreciated in products derived from these data.
  1. Who distributes the data set? (Distributor 1 of 1)
    U.S. Geological Survey
    MS 902, Box 25046, Denver Federal Center
    Lakewood, CO

    (303) 236-5486 (voice)
    webmaster@greenwood.cr.usgs.gov
  2. What's the catalog number I need to order this data set? MF-2347
  3. What legal disclaimers am I supposed to read?
    Any use of trade names in this publication is for descriptive purposes only and does not imply endorsement by the U.S. Government. Although this digital spatial data has been subjected to rigorous review and is substantially complete, it is released on the condition that neither the USGS nor the United States Government may be held liable for any damages resulting from its authorized or unauthorized use.
  4. How can I download or order the data?

Who wrote the metadata?

Dates:
Last modified: 05-Feb-2016
Metadata author:
Peter N Schweitzer
USGS Midwest Area
Collection manager, USGS Geoscience Data Clearinghouse, http://geo-nsdi.er.usgs.gov/
Mail Stop 954
12201 Sunrise Valley Dr
Reston, VA
USA

703-648-6533 (voice)
703-648-6252 (FAX)
pschweitzer@usgs.gov
Metadata standard:
Content Standard for Digital Geospatial Metadata (FGDC-STD-001-1998)

This page is <https://geo-nsdi.er.usgs.gov/metadata/map-mf/2347/metadata.faq.html>
Generated by mp version 2.9.48 on Tue Jul 03 20:05:04 2018