Geologic Map of the Silt Quadrangle, Garfield County, Colorado

Metadata also available as - [Outline] - [Parseable text] - [XML]

Frequently anticipated questions:


What does this data set describe?

Title: Geologic Map of the Silt Quadrangle, Garfield County, Colorado
Abstract:
New 1:24,000-scale geologic mapping in the Silt 7.5' quadrangle, in support of the USGS Western Colorado I-70 Corridor Cooperative Geologic Mapping Project, provides new interpretations of the stratigraphy, structure, and geologic hazards in the area of the southwest flank of the White River uplift, the Grand Hogback, and the eastern Piceance Basin.
The Wasatch Formation was subdivided into three formal members, the Shire, Molina, and Atwell Gulch Members. Also a sandstone unit within the Shire Member was broken out. The Mesaverde Group consists of the upper Williams Fork Formation and the lower Iles Formation. Members for the Iles Formation consist of the Rollins Sandstone, the Cozzette Sandstone, and the Corcoran Sandstone Members. The Cozzette and Corcoran Sandstone Members were mapped as a combined unit. Only the upper part of the Upper Member of the Mancos Shale is exposed in the quadrangle.
From the southwestern corner of the map area toward the northwest, the unfaulted early Eocene to Paleocene Wasatch Formation and underlying Mesaverde Group gradually increase in dip to form the Grand Hogback monocline that reaches 45-75 degree dips to the southwest (section A-A'). The shallow west- northwest-trending Rifle syncline separates the northern part of the quadrangle from the southern part along the Colorado River.
Geologic hazards in the map area include erosion, expansive soils, and flooding. Erosion includes mass wasting, gullying, and piping. Mass wasting involves any rock or surficial material that moves downslope under the influence of gravity, such as landslides, debris flows, or rock falls, and is generally more prevalent on steeper slopes. Locally, where the Grand Hogback is dipping greater than 60 degrees and the Wasatch Formation has been eroded, leaving sandstone slabs of the Mesa Verde Group unsupported over vertical distances as great as 500 m, the upper part of the unit has collapsed in landslides, probably by a process of beam-buckle failure. In the source area of these landslides strata are overturned and dip shallowly to the northeast. Landslide deposits now armor Pleistocene pediment surfaces and extend at least 1 km into Cactus Valley. Gullying and piping generally occur on more gentle slopes. Expansive soils and expansive bedrock are those unconsolidated materials or rocks that swell when wet and shrink when dry. Most floods are restricted to low-lying areas.
Several gas-producing wells extract methane from coals from the upper part of the Iles Formation.
Supplemental_Information:
Map political location: Garfield County, Colorado Compilation scale: 1:24,000 Geology mapped in 1992 to 1996. Compilation completed March 1997.
  1. How might this data set be cited?
    Shroba, Ralph R., and Scott, Robert B., 2001, Geologic Map of the Silt Quadrangle, Garfield County, Colorado: U.S. Geological Survey Miscellaneous Field Studies Map MF-2331, U.S. Geological Survey, Denver, Colorado.

    Online Links:

  2. What geographic area does the data set cover?
    West_Bounding_Coordinate: -107.75
    East_Bounding_Coordinate: -107.625
    North_Bounding_Coordinate: 39.625
    South_Bounding_Coordinate: 39.50
  3. What does it look like?
    http://pubs.usgs.gov/mf/2001/mf-2331/mf-2331.gif (GIF)
    Graphic representation of map layout, 400x422 pixels 24-bit color.
    http://pubs.usgs.gov/mf/2001/mf-2331/mf-2331.pdf (PDF)
    Graphic representation of map layout, 2.8 megabytes.
  4. Does the data set describe conditions during a particular time period?
    Calendar_Date: 2001
    Currentness_Reference:
    publication date
  5. What is the general form of this data set?
    Geospatial_Data_Presentation_Form: map
  6. How does the data set represent geographic features?
    1. How are geographic features stored in the data set?
      This is a Vector data set.
    2. What coordinate system is used to represent geographic features?
      The map projection used is Polyconic.
      Projection parameters:
      Longitude_of_Central_Meridian: -107.68750000
      Latitude_of_Projection_Origin: 39.50000
      False_Easting: 0.0
      False_Northing: 0.0
      Planar coordinates are encoded using coordinate pair
      Abscissae (x-coordinates) are specified to the nearest 10
      Ordinates (y-coordinates) are specified to the nearest 10
      Planar coordinates are specified in METERS
      The horizontal datum used is North American Datum of 1927.
      The ellipsoid used is Clarke 1866.
      The semi-major axis of the ellipsoid used is 6378206.4.
      The flattening of the ellipsoid used is 1/294.98.
  7. How does the data set describe geographic features?
    Entity_and_Attribute_Overview:

    The data are supplied in ARC/INFO export format.
    DATABASE STRUCTURE - ARC/INFO ====================================
    The database of the map consists of three coverages (root name = silt), including corresponding info files:
    This GIS database includes related look-up tables, which store detailed attribute information. Arc/Info relates for each coverage are saved in a file named <covername>.rel. Use the RELATE command with the restore argument at the arc prompt to make the relates active. Alternatively, in Arctools, use the Relate environment: open dialog in the Manage - Relates flyout menu under the Arctools menu to make the relates active.
    siltpoly coverage: contains all contact lines and labelpoints for each geologic polygon; also contains lines that are limit of overturned strata. In the denvpoly.pat INFO file the LABEL item indicates the rock unit label (abbreviation) used to label the unit on the map. The DESC item contains the formal or informal unit name. The SOURCE item contains the numeric code used to identify the data source for the rock unit. The SYMBOL item contains the shadeset symbol number used by ArcInfo to plot a filled/shaded polygon. The symbol numbers in this coverage refer to the color524.shd shadeset.
    In the coverage's siltpoly.aat INFO file the NAME item contains the name given to the structural feature. The SOURCE item contains the numeric code used to identify the data source for the structural feature. The SYMBOL item contains the lineset symbol number used by ArcInfo to plot a line. The symbol numbers in this coverage refer to the geol_sfo.lin lineset.
    In the coverage's siltpoly.ref INFO file the SOURCE item lists the numeric code used to identify the data source. The scale item lists the scale of the source map. (This value is the denominator of the proportional fraction that identifies the scale of the map that was digitized or scanned to produce the digital map.) The AUTHORS item lists the author(s) or compiler(s) of source map entered as last name, first name or initial, and middle initial. The YEAR item lists the source (map) publication date. The REFERENCE item lists the remainder of the reference in USGS reference format.
    The INFO structure of these files is listed below:
    SILTPOLY.AAT
    COLUMN   ITEM NAME        WIDTH OUTPUT  TYPE N.DEC  ALTERNATE NAME
        1  FNODE#                 4     5     B      -
        5  TNODE#                 4     5     B      -
        9  LPOLY#                 4     5     B      -
       13  RPOLY#                 4     5     B      -
       17  LENGTH                 8    18     F      5
       25  SILTPOLY#              4     5     B      -
       29  SILTPOLY-ID            4     5     B      -
       33  LINECODE               3     3     I      -
       36  NAME                  30    30     C      -
       66  SOURCE                 4     4     I      -
       70  SYMBOL                 3     3     I      -
    SILTPOLY.PAT
    COLUMN   ITEM NAME        WIDTH OUTPUT  TYPE N.DEC  ALTERNATE NAME
        1  AREA                   8    18     F      5
        9  PERIMETER              8    18     F      5
       17  SILTPOLY#              4     5     B      -
       21  SILTPOLY-ID            4     5     B      -
       25  SOURCE                 4     4     I      -
       29  LABEL                 10    10     C      -
       39  DESC                 100   100     C      -
      139  SYMBOL                 3     3     I      -
    SILTPOLY.CON
    COLUMN   ITEM NAME        WIDTH OUTPUT  TYPE N.DEC  ALTERNATE NAME
        1  LINECODE               3     3     I      -
        4  SYMBOL                 3     3     I      -
        7  TYPE                  10    10     C      -
       17  MODIFIER              20    20     C      -
       37  CERTAINTY             15    15     C      -
       52  DESC                 100   100     C      -
    SILTPOLY.REF
    COLUMN   ITEM NAME        WIDTH OUTPUT  TYPE N.DEC  ALTERNATE NAME
        1  SOURCE                 4     4     I      -
        5  SCALE                  8     8     I      -
       13  AUTHORS              200   200     C      -
      213  YEAR                   4     4     I      -
      217  REFERENCE            250   250     C      -
    
    siltline coverage: contains cross-section lines and a synclinal fold axis line. In the siltline.aat INFO file the NAME item indicates the name given to the structural feature. The SOURCE item contains the numeric code used to identify the data source for the structural feature. The DESC item contains the written description or explanation of the contact, boundary, or structural feature. The SYMBOL item contains the lineset symbol number used by ArcInfo to plot a line. The symbol numbers in this coverage refer to the geol_sfo.lin lineset.
    In the coverage's siltline.ref INFO file the SOURCE item lists the numeric code used to identify the data source. The scale item lists the scale of the source map. (This value is the denominator of the proportional fraction that identifies the scale of the map that was digitized or scanned to produce the digital map.) The AUTHORS item lists the author(s) or compiler(s) of source map entered as last name, first name or initial, and middle initial. The YEAR item lists the source (map) publication date. The REFERENCE item lists the remainder of the reference in USGS reference format.
    The INFO structure of these files is listed below:
    SILTLINE.AAT
    COLUMN   ITEM NAME        WIDTH OUTPUT  TYPE N.DEC  ALTERNATE NAME
        1  FNODE#                 4     5     B      -
        5  TNODE#                 4     5     B      -
        9  LPOLY#                 4     5     B      -
       13  RPOLY#                 4     5     B      -
       17  LENGTH                 8    18     F      5
       25  SILTLINE#              4     5     B      -
       29  SILTLINE-ID            4     5     B      -
       33  LINECODE               3     3     I      -
       36  NAME                  30    30     C      -
       66  SOURCE                 4     4     I      -
       70  DESC                 100   100     C      -
      170  SYMBOL                 3     3     I      -
    SILTLINE.CON
    COLUMN   ITEM NAME        WIDTH OUTPUT  TYPE N.DEC  ALTERNATE NAME
        1  LINECODE               3     3     I      -
        4  SYMBOL                 3     3     I      -
        7  TYPE                  10    10     C      -
       17  MODIFIER              20    20     C      -
       37  CERTAINTY             15    15     C      -
       52  DESC                 100   100     C      -
    SILTLINE.STR
    COLUMN   ITEM NAME        WIDTH OUTPUT  TYPE N.DEC  ALTERNATE NAME
        1  LINECODE               3     3     I      -
        4  SYMBOL                 3     3     I      -
        7  TYPE                  10    10     C      -
       17  HORIZONTAL            20    20     C      -
       37  VERTICAL              20    20     C      -
       57  FOLD                  15    15     C      -
       72  PLUNGE                15    15     C      -
       87  ACCURACY              15    15     C      -
      102  CERTAINTY             15    15     C      -
      117  DESC                 100   100     C      -
    SILTLINE.REF
    COLUMN   ITEM NAME        WIDTH OUTPUT  TYPE N.DEC  ALTERNATE NAME
        1  SOURCE                 4     4     I      -
        5  SCALE                  8     8     I      -
       13  AUTHORS              200   200     C      -
      213  YEAR                   4     4     I      -
      217  REFERENCE            250   250     C      -
    
    siltpnt coverage: Contains points recording site-specific observations and measurements, such as strike and dip of bedding. In the siltpnt.pat INFO file the PTTYPE item lists the type of point symbol, e.g., strike and of inclined bedding. The MARKER item lists the markerset used for a particular PTTYPE. MARKER value 1 = GEOSCAMP2.MRK, 2 = OILGAS.MRK, 3 = USGS.MRK. OILGAS.MRK and USGS.MRK are standard ArcInfo markersets. The SYMBOLCD item lists the marker symbol used by ArcInfo to identify the type of structural map symbol. Symbol numbers refer to symbols in the 3 markersets listed above. The STRIKE item contains the strike of bedding. Strike is an azimuthal angle (measured in degrees from 0 to 360 in a clockwise direction from North). The DIP item contains the dip of bedding. This value is an angle measured (in degrees 0 to 90) down from the horizontal; thus a horizontal dip is 0 degrees and a vertical dip is 90 degrees. The CALCANG item contains an interim value used to calculate SYM$ANGLE. The SYM$ANGLE item is the angle used to mathematically rotate the map point symbol to its proper orientation on the map. This item was set equal to the pseudoitem '$ANGLE' (calc SYM$ANGLE = $ANGLE). The SOURCE item lists the numeric code used to identify the data source.
    In the coverage's siltpnt.ref INFO file the SOURCE item lists the numeric code used to identify the data source. The scale item lists the scale of the source map. (This value is the denominator of the proportional fraction that identifies the scale of the map that was digitized or scanned to produce the digital map.) The AUTHORS item lists the author(s) or compiler(s) of source map entered as last name, first name or initial, and middle initial. The YEAR item lists the source (map) publication date. The REFERENCE item lists the remainder of the reference in USGS reference format.
    The INFO structure of these files is listed below:
    SILTPNT.PAT
    COLUMN   ITEM NAME        WIDTH OUTPUT  TYPE N.DEC  ALTERNATE NAME
        1  AREA                   8    18     F      5
        9  PERIMETER              8    18     F      5
       17  SILTPNT#               4     5     B      -
       21  SILTPNT-ID             4     5     B      -
       25  PTTYPE                80    80     C      -
      105  SYMBOLCD               3     3     I      -
      108  STRIKE                 3     3     I      -
      111  DIP                    3     3     I      -
      114  CALCANG                4     4     I      -
      118  SYM$ANGLE              4     4     I      -
      122  MARKER                 3     3     I      -
      125  SOURCE                 4     4     I      -
    SILTPNT.REF
    COLUMN   ITEM NAME        WIDTH OUTPUT  TYPE N.DEC  ALTERNATE NAME
        1  SOURCE                 4     4     I      -
        5  SCALE                  8     8     I      -
       13  AUTHORS              200   200     C      -
      213  YEAR                   4     4     I      -
      217  REFERENCE            250   250     C      -
    
    Auxiliary files:
    color524.shd: This shadeset file defines the rgb values of colors assigned to polygons in the siltpoly coverage (see SYMBOL item).
    geol_sfo.lin: This lineset file defines geologic line types in the geologically themed coverages.
    geoscamp2.mrk: This markerset file defines the geologic markers in the geologically themed coverages.
    mf-2331_screen.pdf: A screen optimized file for viewing and printing a graphics version of the map and accessory elements using Adobe Acrobat viewing software (version 4.0). Accessory map elements displayed in this graphics file are: (1) geologic cross section A-A", (2) geologic cross section B-B', (3) correlation of map units diagram, (4) list of map unit symbols and names, and (5) explanation of map symbols.
    mf-2331_print.pdf: A print optimized file for viewing and printing a graphics version of the map and accessory elements using Adobe Acrobat viewing software (version 4.0). Accessory map elements displayed in this graphics file are: (1) geologic cross section A-A", (2) geologic cross section B-B', (3) correlation of map units diagram, (4) list of map unit symbols and names, and (5) explanation of map symbols.
    mf-2331_pamphlet.pdf: A detailed textual description of geologic map units and a brief discussion of deposits, structure, and geologic history of the map area.
    Database root name: silt
    Label	            Desc
    af	      Artificial fill (latest Holocene)
    Qfp	      Flood-plain and stream-channel deposits (Holocene and late Pleistocene)
    Qty	      Younger terrace alluvium (late Pleistocene)
    Qtm	      Intermediate terrace alluvium (late Pleistocene)
    Qto	      Older terrace alluvium (late middle Pleistocene)
    Qba	      Basaltic alluvium (late middle Pleistocene)
    Qg	      Gravelly alluvium (late and middle Pleistocene)
    Qtt	      Oldest terrace alluvium (middle Pleistocene)
    Qfy	      Younger fan-alluvium and debris-flow deposits (Holocene and latest
                Pleistocene)
    Qac	      Alluvium and colluvium, undivided (Holocene and late Pleistocene)
    Qp	      Pediment deposits (middle Pleistocene)
    Qc         Colluvium, undivided (Holocene to middle? Pleistocene)
    Qsw	      Sheetwash deposits (Holocene and late Pleistocene)
    Qsw/Qlo    Sheetwash deposits over loess
    Qls	      Landslide deposits (Holocene to middle? Pleistocene)
    Qd	      Debris-flow deposits (Holocene? to middle? Pleistocene
    Qdo	      Older debris-flow deposits (early? Pleistocene)
    Qlo	      Loess (late and middle? Pleistocene)
    Qlo/Qty    Loess over younger terrace alluvium
    Qlo/Qtm    Loess over intermediate terrace alluvium
    Qlo/Qto    Loess over older terrace alluvium
    Qlo/Qd     Loess over debris-flow deposits
    Qlo/Qtt    Loess over oldest terrace alluvium
    Qlo/Qp     Loess over pediment deposits
    Qlo/Qtt/Qp Loess over oldest terrace alluvium over pediment deposits
    Tw         Wasatch Formation (in cross section only) (Eocene to Paleocene)
    Tws	      Shire Member of Wasatch Formation (Eocene)
    Twss	      Sandstone unit of Shire Member of Wasatch Formation
    Twm 	      Molina Member of Wasatch Formation (Eocene)
    Twa	      Atwell Gulch Member of Wasatch Formation (in cross section only)
                (Paleocene)
    Twav	      Volcaniclastic-rich unit of Atwell Gulch Member of Wasatch Formation
    Twal	      Lower unit of Atwell Gulch Member of Wasatch Formation
    Kmv	      Mesaverde Group (in cross section only) (Upper Cretaceous)
    Kwf	      Williams Fork Formation of Mesaverde Group
    Kwfu	      Upper unnamed sandstone unit of Williams Fork Formation of Mesaverde Group
    Kwfl	      Lower unnamed sandstone unit of Williams Fork Formation of Mesaverde Group
    Ki	      Iles Formation of Mesaverde Group
    Kir	      Rollins Sandstone Member of Iles Formation of Mesaverde Group
    Kicc	      Cozzette Sandstone and Corcoran Sandstone Members, undivided, of the Iles
                Formation of Mesaverde Group
    Kmvb	      Baked zone in the Mesaverde Group
    Kmu	      Mancos Shale, Upper member (Upper Cretaceous)
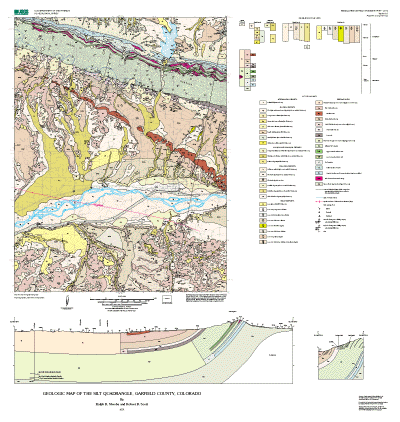
    DEFINITION OF LINECODES IN THE COVERAGES (LINECODES AND DESC IN THE .CON AND .STR
    FEATURES IN THE DATABASE-------------------------
    LINECODE |   DESC
        1    | contact; certain
        2    | contact; approximately located
       41    | water boundary
       81    | map boundary (lines of latitude or longitude)
       88    | limit of overturned strata
       98    | cross-section line
      413    | fold axis; syncline; certain
    
    Entity_and_Attribute_Detail_Citation: http://pubs.usgs.gov/mf/2001/mf-2331/mf-2331pam.pdf

Who produced the data set?

  1. Who are the originators of the data set? (may include formal authors, digital compilers, and editors)
    • Ralph R. Shroba
    • Robert B. Scott
  2. Who also contributed to the data set?
  3. To whom should users address questions about the data?
    Ralph R. Shroba
    U.S. Geological Survey
    MS 913, Box 25046 DFC
    Denver, CO

    303-236-1292 (voice)
    rshroba@usgs.gov

Why was the data set created?

To update and reinterpret earlier geologic mapping, and to provide sufficient geologic information for land-use decisions.

How was the data set created?

  1. From what previous works were the data drawn?
    USGS OFR 94-696 (source 1 of 1)
    Shroba, Ralph R., Fairer, George M., and Green, Morris W., 1994, Preliminary Geologic Map of the SILT Quadrangle, Garfield County, Colorado: U.S. Geological Survey Open-File Report 94-696, U.S. Geological Survey, Denver, CO.

    Online Links:

    Type_of_Source_Media: digital data
    Source_Scale_Denominator: 24000
    Source_Contribution: USGS MF-2331 supersedes USGS OFR 94-696.
  2. How were the data generated, processed, and modified?
    Date: 1999 (process 1 of 9)
    Polygons, lines, and points representing geologic features and data points were digitized from scale-stable compilation materials using the GSMCAD public domain program (USGS Open-File Report 96-007).
    Date: 1999 (process 2 of 9)
    The map data were exported to ARC/INFO by the GSMCAD export function to create ARC generate ASCII files. The ASCII files were then imported into ArcInfo by the GENERATE routine, and polygon topology built.
    Date: 1999 (process 3 of 9)
    The gsmdraw.aml program was used in ARC to produce a graphics file of the colored map. In addition an explanation sheet was produced that includes a correlation of map units diagram, a list of map unit names and corresponding symbols, and an explanation of graphical map symbols.
    Date: 1999 (process 4 of 9)
    Text map unit descriptors were added to the .AAT and .PAT database files for each coverage.
    Date: 1999 (process 5 of 9)
    Draft check plots of the geologic map and explanation were created and submitted for peer review. Geologists reviewed the plots for scientific validity and clarity and for conformity with USGS standards for stratigraphic nomenclature. Revisions were made to the geospatial database as needed.
    Date: 2000 (process 6 of 9)
    The database files, metadata, and check plots were edited by the USGS Central Publications Group, and revisions made to the geospatial database as needed.
    Date: 2001 (process 7 of 9)
    The geospatial database files and metadata were quality checked for completeness and consistency.
    Date: 2001 (process 8 of 9)
    Final preparation of the geospatial database for distribution, and preparation of map-on-demand files and metadata.
    Date: 19-Jun-2000 (process 9 of 9)
    Creation of original metadata record Person who carried out this activity:
    Ralph R. Shroba
    U.S. Geological Survey
    U.S. Geological Survey
    Lakewood, CO

    303-236-1292 (voice)
    rshroba@usgs.gov
  3. What similar or related data should the user be aware of?

How reliable are the data; what problems remain in the data set?

  1. How well have the observations been checked?
    Data were entered and checked by the geologist that made the field observations. The attributes of this geospatial data set consist of text identifiers and numeric codes that indicate the identity of the geologic unit or type of geologic feature, and determine how each feature is colored or symbolized. To check attribute accuracy, a color check plot was visually compared to the geologist's original compilation. Discrepancies between the digital geospatial dataset and the original analog compilation were corrected as needed. Machine-created listings of unique attribute values were used to identify spelling errors or other inconsistencies, and corrections were made as needed. This map has been thoroughly reviewed for conformity with U.S. Geological Survey editorial standards and stratigraphic nomenclature.
  2. How accurate are the geographic locations?
    Lines were primarily positioned by photointerpretation of aerial photographs by using a PG-2 photogrammetric plotter that rectified the position and transferred it to a basemap. Lines were digitized from the basemap by using a digitizer tablet having a resolution of 0.001 inch. Additional lines and point observations were added in the field by means of positions determined by a PLGR-95 GPS unit having accuracy of about 10 meters. Most positions on the map are estimated to be accurate closer than 30 m horizontally.
  3. How accurate are the heights or depths?
  4. Where are the gaps in the data? What is missing?
    Data are complete: no features that could be accurately represented at the compilation scale of 1:24,000 were eliminated or generalized. The smallest area represented is approximately 102 square meters. All geospatial database elements are attributed.
  5. How consistent are the relationships among the observations, including topology?
    Map elements were visually checked for overshoots, undershoots, duplicate features, polygon closure, and other errors by the author and by the GIS technician(s) that created the digital database. Automated (ArcInfo) routines were also used to check the databases for polygon label errors, line or point attribution errors, sliver polygons, dangling arcs, intersection errors, and projection information. Check plots of the map were reviewed by at least two other geologists for consistency with basic geologic principles and general conformity to USGS mapping standards.

How can someone get a copy of the data set?

Are there legal restrictions on access or use of the data?
Access_Constraints: none
Use_Constraints:
none. Acknowledgment of the U.S. Geological Survey would be appreciated in products derived from these data.
  1. Who distributes the data set? (Distributor 1 of 1)
    U.S.Geological Survey
    USGS Information Services
    Denver, CO
    United States

    1-888-ASK-USGS (voice)
  2. What's the catalog number I need to order this data set? USGS Miscellaneous Field Studies Map MF-2331
  3. What legal disclaimers am I supposed to read?
    Although this digital spatial data has been subjected to rigorous review and is substantially complete, it is released on the condition that neither the USGS nor the United States Government may be held liable for any damages resulting from its authorized or unauthorized use.
  4. How can I download or order the data?

Who wrote the metadata?

Dates:
Last modified: 14-Jun-2016
Metadata author:
Peter N Schweitzer
USGS Midwest Area
Collection manager, USGS Geoscience Data Clearinghouse, http://geo-nsdi.er.usgs.gov/
Mail Stop 954
12201 Sunrise Valley Dr
Reston, VA
USA

703-648-6533 (voice)
703-648-6252 (FAX)
pschweitzer@usgs.gov
Metadata standard:
Content Standard for Digital Geospatial Metadata (FGDC-STD-001-1998)

This page is <https://geo-nsdi.er.usgs.gov/metadata/map-mf/2331/metadata.faq.html>
Generated by mp version 2.9.48 on Tue Jul 03 20:05:00 2018