Spatial Digital Database for the Tectonic Map of Southeast Arizona

Metadata also available as - [Outline] - [Parseable text] - [XML]

Frequently anticipated questions:


What does this data set describe?

Title:
Spatial Digital Database for the Tectonic Map of Southeast Arizona
Abstract:
A spatial database was created for the Drewes (1980) tectonic map of southeast Arizona: this database supercedes Drewes and others (2001, ver. 1.0). The west tectonic map (Drewes, 1980) was converted to digital format by Optronics Specialty Co., Inc. and published in 2001. Staff and a contractor at the U.S. Geological Survey in Tucson, Arizona developed a digital geologic map database for the east map in 2001, made revisions to the previously released digital data for the west map (Drewes and others, 2001, ver. 1.0), merged data files for the east and west sheets, and added additional data not previously captured.
Supplemental_Information:
Contractors at the U.S. Geological Survey in Spokane, Washington, completed an interim digital database, version 1.0, with line and polygon features for Sheet 2 in 2001. The database in version 2.0 contains revisions to the Sheet 2 database and additional data such as structural strike and dip, collection sample, marker bed, marker horizon and geomorphic feature data for both Sheets 1 and 2. Digital base map data files (topography, roads, towns, rivers and lakes, etc.) are not included. Since the Drewes (1980) east and west map sheets have additional data that was not included in this database, scanned images are included as a courtesy to the reader. The digital geologic map plot files (i1109_e.hp/.eps/.pdf and i1109_w.hp/.eps/.pdf) provided in the digital package are a representation of the database. These files will not print a copy of the original Drewes (1980) Tectonic Map of Southeast Arizona.
The text report (i1109.pdf) describes the map units, the methods used to convert the geologic map data into a digital format, the ArcInfo GIS file structures and relationships, and explains how to download the digital files from the U.S. Geological Survey public access World Wide Web site on the Internet.
  1. How might this data set be cited?
    Drewes, Harald, Fields, Robert A., Hirschberg, Douglas M., and Bolm, Karen S., 2002, Spatial Digital Database for the Tectonic Map of Southeast Arizona: USGS Miscellaneous Investigations Series Map I-1109, U.S. Geological Survey, Menlo Park, California.

    Online Links:

  2. What geographic area does the data set cover?
    West_Bounding_Coordinate: -111.32
    East_Bounding_Coordinate: -109.00
    North_Bounding_Coordinate: 32.26
    South_Bounding_Coordinate: 31.32
  3. What does it look like?
    http://geo-nsdi.er.usgs.gov/metadata/map-i/1109/i1109.png (PNG)
    Reduced-size image of the map layout, 1054x775 pixels, 120k bytes.
  4. Does the data set describe conditions during a particular time period?
    Calendar_Date: 2002
    Currentness_Reference:
    Publication supercedes Harald Drewes, William N. Kelley and Steven R. Munts, (2001).
  5. What is the general form of this data set?
    Geospatial_Data_Presentation_Form: map
  6. How does the data set represent geographic features?
    1. How are geographic features stored in the data set?
      This is a Vector data set. It contains the following vector data types (SDTS terminology):
      • Point (8787)
      • String (24743)
      • GT-polygon composed of chains (8788)
    2. What coordinate system is used to represent geographic features?
      Grid_Coordinate_System_Name: Universal Transverse Mercator
      Universal_Transverse_Mercator:
      UTM_Zone_Number: 12
      Transverse_Mercator:
      Scale_Factor_at_Central_Meridian: 0.9996
      Longitude_of_Central_Meridian: -111
      Latitude_of_Projection_Origin: 0.0
      False_Easting: 500000
      False_Northing: 0
      Planar coordinates are encoded using coordinate pair
      Abscissae (x-coordinates) are specified to the nearest 0.01
      Ordinates (y-coordinates) are specified to the nearest 0.01
      Planar coordinates are specified in Meters
      The horizontal datum used is North American Datum of 1927.
      The ellipsoid used is Clarke 1866.
      The semi-major axis of the ellipsoid used is 6378206.4.
      The flattening of the ellipsoid used is 1/294.98.
  7. How does the data set describe geographic features?
    Entity_and_Attribute_Overview:
    The Spatial Digital Database for the Tectonic Map of Southeast Arizona report, i1109.pdf, contains a detailed description of each attribute code and a reference to the associated map symbols on the map source materials. The digital tectonic map of southeast Arizona includes a geologic (linear feature) arc attribute table, i1109.aat, which relates to the i1109.con, i1109.st2, i1109.lgu and i1109.ref files. A rock unit polygon attribute table, i1109.pat, relates to the i1109.ru and i1109.ref files. Point features representing structural attitudes of bedding, fault planes, foliation and lineation are located in the point attribute table, i1109sdp.pat, which relates to the i1109sdp.ref file. Geomorphic features such as paleoplayas, exotic breccia zones and maar craters are located in i1109gm.pat and its related i1109gm.ref file. Points representing cinder cones are located in i1109cin.pat and its related i1109cin.ref file. Points representing rock sample sites and radiometric age dates are contained in i1109sam.pat and its related i1109sam.ref file. Information on ArcInfo interchange files is listed in the i1109.pdf text report.
    Entity_and_Attribute_Detail_Citation: http://pubs.usgs.gov/imap/i1109/i1109.pdf

Who produced the data set?

  1. Who are the originators of the data set? (may include formal authors, digital compilers, and editors)
    • Harald Drewes
    • Robert A. Fields
    • Douglas M. Hirschberg
    • Karen S. Bolm
  2. Who also contributed to the data set?
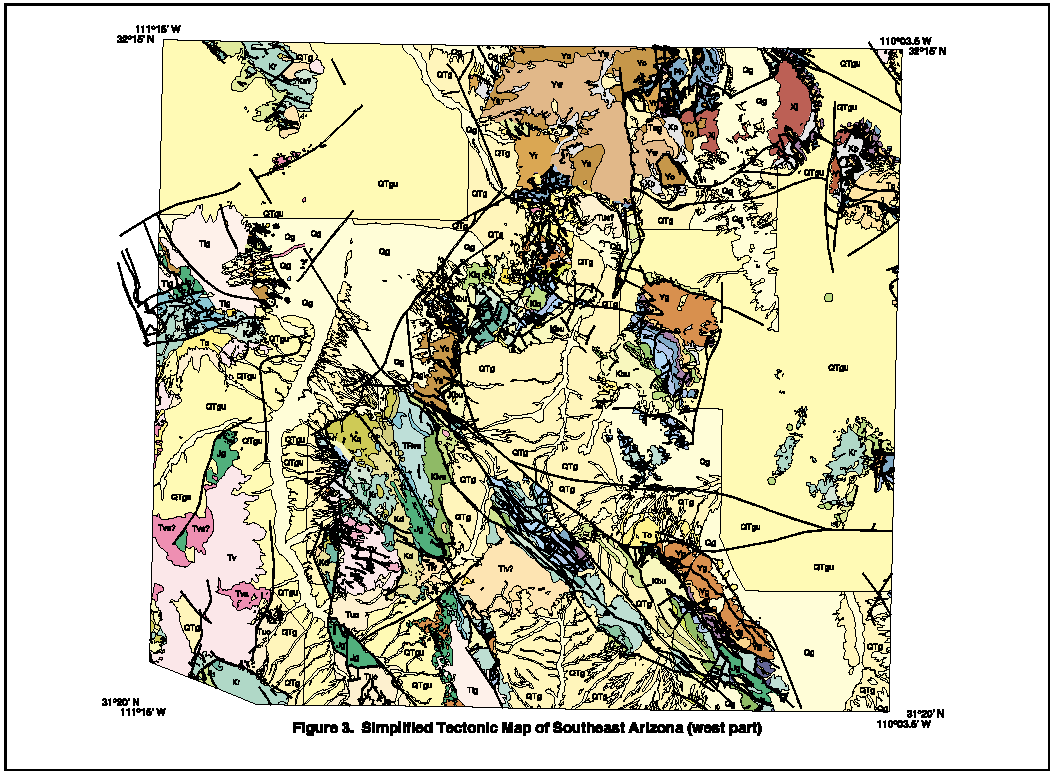
    The geologic map database was initially prepared from folded paper geologic maps (Drewes, 1980) by the staff at Optronics Specialty Co., Inc. Optronics scanned the geologic map and prepared minimally attributed ArcInfo exchange-format files. William N. Kelley and Steven R. Munts (contractors) georeferenced and transformed the data for Sheets 1 and 2 and completed the editing, data model preparation and attributing of arcs and polygons for the west sheet (Sheet 2). Robert A. Fields, Douglas M. Hirschberg (contractor) and Karen S. Bolm reviewed and edited the files for both sheets and developed additional spatial and attribute data. The manuscript and digital data were reviewed by Helen Kayser (contractor) and Pamela Derkey at the USGS Spokane office.
  3. To whom should users address questions about the data?
    Floyd Gray
    U.S. Geological Survey
    Geologist
    USGS Geologic Division
    Dennis DeConcini Environmental & Natural Resources Bldg.
    520 North Park Ave., Room 357
    Tucson, Arizona
    USA

    520-670-5582 (voice)
    520-670-5571 (FAX)
    fgray@usgs.gov

Why was the data set created?

This digital geospatial database is one of many being created by the U.S. Geological Survey as an ongoing effort to provide geologic information in a geographic information system (GIS) for use in spatial analysis. The resulting digital geologic map database data can be queried in many ways to produce a variety of geologic maps and derivative products. This database should not be used or displayed at any scale larger than 1:125,000 (for example, 1:100,000 or 1:24,000).

How was the data set created?

  1. From what previous works were the data drawn?
    Drewes, 1980 (source 1 of 1)
    Drewes, Harald, 1980, Tectonic Map of Southeast Arizona: Miscellaneous Investigation Series Map Map I-1109, U.S. Geological Survey, Denver, CO.

    Type_of_Source_Media: folded paper
    Source_Scale_Denominator: 125000
    Source_Contribution:
    This is the original source for the 2002 dataset. Harald Drewes, William N. Kelley and Steven R. Munts, (2001).
  2. How were the data generated, processed, and modified?
    Date: 2001 (process 1 of 2)
    The geologic maps (Drewes, 1980) were optically scanned by Optronics Specialty Co., Inc. and given minimal attribution. Version 1.0 for the west part of the area was edited and attributed by W. N. Kelley and S. R. Munts (contractors). Version 2.0 for the whole map area was developed by Robert A. Fields (USGS), Douglas M. Hirschberg (contractor) and Karen S. Bolm (USGS).
    Date: 02-Jan-2002 (process 2 of 2)
    Creation of original metadata record Person who carried out this activity:
    U.S. Geological Survey
    Attn: Robert A. Fields
    Geologist
    Dennis DeConcini Environmental & Natural Resources Bldg.
    520 North Park Ave., Room 357
    Tucson, Arizona
    USA

    520-670-5589 (voice)
    520-670-5571 (FAX)
    rafields@usgs.gov
  3. What similar or related data should the user be aware of?
    Drewes, Harald, 1980, Tectonic Map of Southeast Arizona: Miscellaneous Investigation Series Map Map I-1109, U.S. Geological Survey, Denver, CO.

    Online Links:


How reliable are the data; what problems remain in the data set?

  1. How well have the observations been checked?
    Accuracy was verified by manual comparison of the source with hardcopy plots and printouts. Some interpretation of the original data was necessary when map areas covered a very small areal extent, had no labels and were represented with similar color hues. In some cases the decorations for faults on the original map made it difficult to determine where a particular type of fault started and stopped. Numerical values for strike should be considered approximate because they were digitized from the source map and not taken from field notes. The item "strike" also represents lineation bearing and plunge direction to simplify the database. Strike symbols were digitized using the right-hand rule and the strike direction was calculated mathematically. Dip values in the database represent the dip value annotated on the original map.
  2. How accurate are the geographic locations?
    Arcs and points are probably no more accurate than ± 187 meters based upon the RMS error encountered when transforming the dataset based upon mathematically defined tics.
  3. How accurate are the heights or depths?
  4. Where are the gaps in the data? What is missing?
    All geologic units were captured from Drewes (1980) at a scale of 1:125,000. Four concealed contact lines in the "Qg" alluvium map unit in the northwest part of the map were excluded from the database. The original map also had two points with a "Qg?" map unit label and no corresponding contact representing the extent of the map unit. These labels were excluded from the database.
    Three concealed map unit areas labeled "Klq?" on the original west sheet were printed with a color representing the "QTgu" map unit. This database shows these three areas with the green "Klq" color assigned to this map unit. Three lines located in the Yw and Yc map unit in the northern part of the west sheet were undefined in the map explanation and were excluded from this database. Hachured lines representing beach ridges in the Qp map unit along the margins of the Wilcox Playa were not included in the database. Well location, map units penetrated and corresponding thickness data also were not included in this database. Cartographic base map data such as rivers, roads, etc. and map inserts and corresponding explanations, cross sections, references, and other data which were not included in the geospatial database can be viewed in the i1109_e.jpg and i1109_w.jpg raster image files.
  5. How consistent are the relationships among the observations, including topology?
    Polygon and chain-node topology is present. Polygons intersecting the neatline are closed along the border. Segments making up the outer and inner boundaries of a polygon tie end-to-end to completely enclose the area. Polygon slivers and line dangles were removed. Line segments are a set of sequentially numbered coordinate pairs. No duplicate features or duplicate points exist in a data string. Intersecting lines are separated into individual line segments at the point of intersection. Point data are represented by two sets of coordinate pairs, each with the same coordinate values. All nodes are represented by a single coordinate pair indicating the beginning or end of a line segment. The neatline was generated by mathematically generating the four sides of the quadrangle, densifying the lines of latitude and projecting the file to Transverse projection (shown as UTM 12).

How can someone get a copy of the data set?

Are there legal restrictions on access or use of the data?
Access_Constraints: none
Use_Constraints:
This digital database should not be used or displayed at any scale larger than 1:125,000 (for example, 1:100,000 or 1:24,000).
Any hardcopies utilizing these datasets shall clearly indicate their source. If users modify the data in any way they are obligated to describe on the hardcopy map the types of modifications they have performed. Users specifically agree not to misrepresent these datasets, nor to imply that changes they made were approved by the U.S. Geological Survey.
  1. Who distributes the data set? (Distributor 1 of 1)
    USGS Information Services
    Box 25286 Denver Federal Center
    Denver, CO
    USA

    1-888-ASK-USGS (voice)
    303-202-4693 (FAX)
    ask@usgs.gov
  2. What's the catalog number I need to order this data set? USGS Geologic Investigations Series I-1109
  3. What legal disclaimers am I supposed to read?
    The U.S. Geological Survey (USGS) provides these geographic data "as is." The USGS makes no guarantee or warranty concerning the accuracy of information contained in the geographic data. The USGS further makes no warranties, either expressed or implied, as to any other matter whatsoever, including, without limitation, the condition of the product or its fitness for any particular purpose. The burden for determining fitness for use lies entirely with the user. Although these data have been processed successfully on computers at the USGS, no warranty, expressed or implied, is made by the USGS regarding the use of these data on any other system, nor does the fact of distribution construe or imply any such warranty.
    In no event shall the USGS have any liability whatsoever for payment of any consequential, incidental, indirect, special, or tort damages of any kind, including, but not limited to, any loss of profits arising out of use of or reliance on the geographic data or arising out of the delivery, installation, operation, or support by USGS.
    This digital geologic map GIS should not be used or displayed at any scale larger than 1:125,000 (for example, 1:100,000 or 1:24,000).
  4. How can I download or order the data?
    • Availability in digital form:
      Data format: Geologic units and structural features, with graphical images of the map sheet in PDF and JPG formats. in format ARCE (version 8.x) Size: 143
      Network links: http://pubs.usgs.gov/imap/i1109/i1109.tar.Z
    • Cost to order the data: none


Who wrote the metadata?

Dates:
Last modified: 05-Feb-2016
Last Reviewed: 03-Feb-2003
Metadata author:
Peter N Schweitzer
USGS Midwest Area
Collection manager, USGS Geoscience Data Clearinghouse, http://geo-nsdi.er.usgs.gov/
Mail Stop 954
12201 Sunrise Valley Dr
Reston, VA
USA

703-648-6533 (voice)
703-648-6252 (FAX)
pschweitzer@usgs.gov
Metadata standard:
Content Standard for Digital Geospatial Metadata (FGDC-STD-001-1998)

This page is <https://geo-nsdi.er.usgs.gov/metadata/map-i/1109/metadata.faq.html>
Generated by mp version 2.9.48 on Tue Jul 03 20:04:44 2018